COVID-19 UPDATE


Important Notice:Beware of scams using ASOWorld's name for part-time recruitment or ASO earning app activities. ASOWorld is not hiring any part-time staff. Trust only official information posted by ASOWorld.

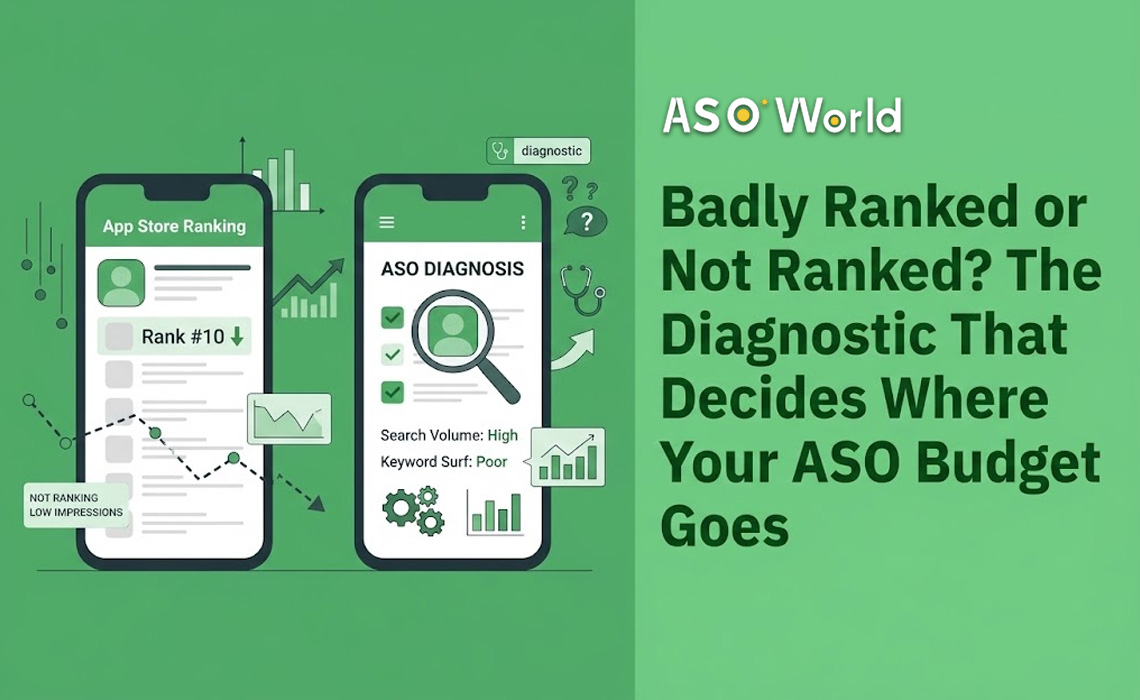
Two developers posted their numbers in ASO communities this year. Both opened with a version of the same sentence: my ASO isn't working.
The first had been live for two weeks with a Food & Drink app on iOS: fewer than 100 impressions in total, but roughly 80% of the people who saw the app opened its product page, and about one in five of those installed it. The second had a puzzle game with 7,240 impressions, 197 product page views, and 58 downloads.
Same complaint. Opposite problems. And — this is the expensive part — opposite fixes.
Almost every ASO article you will read assumes you already have impressions and just need to convert them better. Rewrite the subtitle, redo the first screenshot, test a new icon. For the first developer, every hour of that work would have been wasted, because there was no traffic to convert in the first place. For the second, it was exactly the right advice.
Before you spend another weekend or another dollar, you need to know which of the two you are. This article is the diagnostic.
Put the two cases side by side and the difference is obvious in a way it never is when you are staring at your own dashboard.
Case A has a visibility problem. Case B has a conversion problem. The first is solved by appearing in more places for terms real people type. The second is solved by earning the tap once you appear. Neither fix does anything measurable for the other problem, which is why the diagnosis has to come before the budget.
The developer in Case A, to their credit, had already worked this out and asked the community to sanity-check the reasoning. That instinct was right, and it is worth understanding why.
This is the most counterintuitive number in App Store Connect, so it is worth being precise about what it measures.
An impression is counted when your app appears to someone browsing or searching — in search results, on a category or Today page, in a recommendation shelf. A product page view is counted when someone actually opens your listing. Apple documents both in App Analytics, along with the source type that produced them.
Now think about who taps at an 80% rate. Not someone scanning ten results for a recipe app. That person taps one or two rows at most. An 80% rate means nearly everyone who saw the app had already decided to open it before they saw it — they searched the app by name, followed a link from a video or a post, or came from a referral. Your listing is not competing for their attention; it is completing a decision that was made somewhere else.
That is fine as a channel. It is not discovery. And it caps your growth at exactly the size of your off-store audience.
The number that reveals the real problem is the denominator: fewer than 100 impressions. It means the app is present in the store’s search index but is not surfacing — not appearing high enough, for enough queries, to be seen by anyone who wasn’t already looking for it.
We can borrow a term for the thing that is missing. Call it keyword surface: the set of non-branded queries, with real search volume, where you rank high enough to actually be shown. Not the number of keywords you rank for somewhere. Ranking #180 for 400 terms is a keyword surface of zero. Ranking in the top few rows for eight terms that people genuinely search is a keyword surface that produces installs every day.
Two structural changes have made that surface harder to win, and both are worth reading about separately rather than re-arguing here:
The practical consequence for a new app: the head terms in your category are held by incumbents with years of accumulated signals, and the long tail is now more crowded than it was eighteen months ago. Doing nothing and hoping the algorithm notices you is no longer a neutral choice.
ASOWorld First Order Discount
Get 50% off on your first order to start your app growth!
This takes about an hour and requires no spend. Do it in order.
Not the terms you wish you owned. The terms with measurable search volume that describe what your app does, including the specific long-tail phrasings. If you are unsure how to build that list, our guide to picking the right keywords walks through the selection logic and includes a free keyword list to start from. Then check where you actually rank for each one — you can pull current and historical positions with the ASO keyword ranking tools.
| Rank bucket | What it means | What it is worth today |
|---|---|---|
| 1–10 | Visible. You are on the first screen of results. | This is where installs come from. |
| 11–40 | Indexed and close. Real users rarely scroll here. | Worth pushing — the gap to visible is small. |
| 40+ | Indexed, invisible. | Contributes nothing to discovery yet. |
| Not indexed | The store does not associate you with this term at all. | A metadata problem, not a ranking problem. Fix the listing first. |
If your volume keywords are almost all in the bottom two buckets, stop reading advice about screenshots. You have a visibility problem, and you now know its exact shape.
In App Analytics, break impressions down by source type: App Store Search, App Store Browse, App Referrer, Web Referrer. Then compare:
One honest caveat on the third line, because it comes up constantly: a very low rating count does depress conversion, and a listing with no star line at all is at a genuine disadvantage next to neighbours showing 4.7. The correct response is not to go buy reviews. It is to get enough real users in front of the listing that organic ratings accumulate — which means solving visibility first anyway. The order matters.
Once you know which problem you have, the allocation stops being a matter of taste.
| Visibility problem | Conversion problem | |
|---|---|---|
| Symptom | Impressions low; conversion rates look fine or unusually high | Impressions present; impression-to-page-view or page-view-to-install is weak |
| First action | Get volume keywords into positions where they are actually seen | Rebuild the first screen: icon, title, subtitle, first two screenshots |
| Where the budget goes | Keyword ranking work on a short, specific term list | Creative production and structured testing |
| What not to touch yet | Screenshots. There is no traffic to A/B test with. | Keyword expansion. You already have the traffic. |
| How you know it worked | Rank rises on chosen terms, and search impressions and organic installs rise with it | Impression-to-page-view or page-view-to-install rises at stable impression volume |
| Realistic read time | Days to a few weeks, and it decays if you stop | One test cycle per variant, results compound permanently |
The single most common budgeting mistake is running a creative test on an app with 15 impressions a day. There is no statistical universe in which that test concludes anything. Apple’s own guidance on Product Page Optimization assumes meaningful traffic for the same reason.
Most teams run one ASO calendar for both stores. The two platforms do not behave the same way, and this is one of the least-documented practical differences in the field.
Google Play responds over a multi-day window. Ranking movement typically needs a sustained 7–9 day cycle before the position stabilises, and Play gives you a native experimentation surface — store listing experiments — that also needs days of traffic to reach significance. Plan Play work in weekly blocks, and do not judge a change on day three.
iOS tends to react faster but hold less. Movement can appear within a few days, and it decays once the supporting activity stops, which is why iOS keyword work is normally run as a continuous effort with a minimum of about three days of sustained activity rather than a one-off push. A single burst that lifts a keyword for a week and then releases it produces a chart that looks like success and a month that looks like nothing happened.
The practical implication: a Play test and an iOS push started on the same Monday will produce readable results at different times, and if you evaluate them on the same date you will draw a wrong conclusion about at least one of them. Run two calendars.
Rank going up is not the result. It is the leading indicator. The result is more of the right users.
After a ranking change, put two lines next to each other: the rank movement for each specific term, and daily organic page views and installs. Three patterns show up:
Give it a full 14 days before reallocating, look at the terms individually rather than in aggregate, and be willing to defund the ones that ranked and didn’t pay. Aggregate keyword counts hide exactly the information you need.
If you take one thing from this: low impressions and low conversion are not two degrees of the same problem. They are different problems, and the work that fixes one is wasted on the other. An unusually high impression-to-page-view rate on tiny volume is not a sign of a great listing — it is a sign that only people who already knew you have seen it.
Run the three steps. Bucket your ranks, check your impression sources, and decide which side of the table you are on before you commit a budget.
If you want the rank data for step 1 and step 2 without assembling it by hand, create an account and pull your current and historical keyword positions in the ASO keyword ranking tools. If you would rather have someone read the numbers with you, request a custom solution — it includes a free App Analysis and ASO audit, and the first thing it will tell you is which of these two problems you actually have.
Get a good start for your app optimization with practical ASO guideline!
Want to get the latest Guides & Insights from ASOWorld?
Related posts