TL;DR
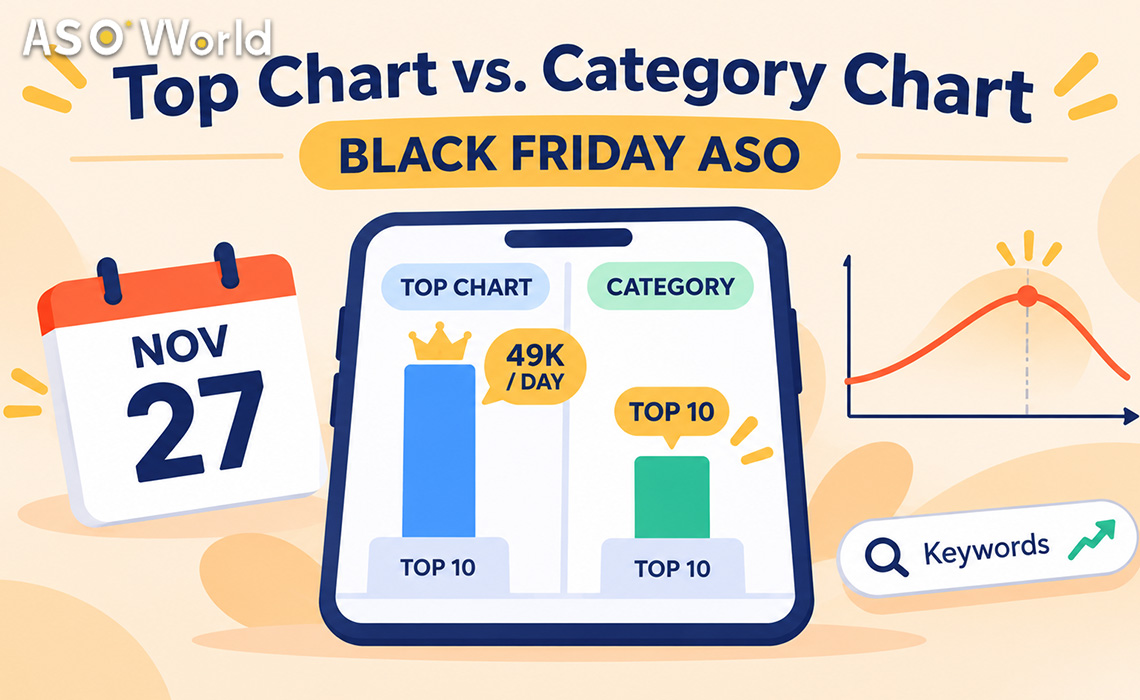
- Overall top charts (Top Free across all apps) are dominated by the biggest brands. Historical US iPhone data put the Top 10 at around 49,000 downloads a day for non-game apps. That is out of reach for almost every small or mid-size app.
- Category charts are where most apps can realistically compete. The bar varies widely, from a few thousand installs a day in a mid-size European country to tens of thousands in the US, Brazil or India.
- Chart rank depends mainly on recent install velocity, so it rises quickly and fades quickly once installs stop. Treat a chart push as a short visibility window. It doesn't last on its own.
- During Black Friday week, Shopping and adjacent categories get much harder because retail apps raise budgets at the same time. Many apps get more for their money from a smaller storefront, a less crowded category, or keyword rankings.
- Before you buy anything, estimate installs per day × days × unit price for the chart you're targeting. If the total is more than your monthly budget, choose a different chart or switch to keywords.
What does each chart really measure?
| |
Overall top chart (e.g. Top Free) |
Category chart (e.g. Shopping, Productivity) |
Keyword search ranking |
| Who competes |
Every app in the store |
Apps in one primary category |
Apps relevant to one search term |
| Main driver |
Recent install velocity at very high volume |
Recent install velocity within the category |
Relevance + installs and engagement from that search term |
| Who sees it |
Users browsing the charts |
Users browsing a category |
Users with a specific intent |
| How fast it moves |
Within days |
Within days |
Days to about two weeks, depending on the store |
| How fast it fades |
Very fast |
Fast |
Slower; positions can hold at a lower maintenance pace |
| Realistic for small apps? |
Rarely |
Often, in the right category and country |
Yes, especially on long-tail terms |
Google Play charts are widely understood to factor in more than raw installs (quality and engagement signals, for example). So on Google Play, a push that brings installs without engagement tends to move the chart less, and for a shorter time.
How many installs does it take to reach the charts?
Public benchmarks are rare and get old quickly, but they give you a sense of scale.
US iPhone, overall Top Free (Sensor Tower, first half of 2019, median daily downloads)
| Position |
Non-game apps |
Games |
| #1 |
~94,000 / day |
~174,000 / day |
| Top 10 |
~49,000 / day |
~43,000 / day |
US iPhone, #10 in category (Sensor Tower, first half of 2019)
| Category |
Daily downloads for #10 |
| Photo & Video |
16,000+ |
| Shopping |
~15,300 |
| Social Networking |
~14,500 |
| Entertainment |
~12,600 |
| Productivity |
~12,400 |
Google Play, #1 in category (AppTweak estimates, published 2022, updated 2025)
| Country & category |
Daily downloads for #1 |
| Spain, Travel |
~4,400 |
| Germany, Travel & Local |
~8,000 |
| US, Sports |
~13,000 |
| Brazil, Sports |
~30,000 |
| India, Sports |
~87,000 |
Takeaways:
- The overall chart costs several times more than a category chart in the same country.
- Country matters as much as category. #1 in a mid-size European travel category can take a fraction of what US sports takes, and India's large Google Play market raises the bar sharply.
- Less crowded storefronts are a different game. In smaller countries and quieter categories, a few hundred extra installs a day can move category position within one to three days. That's why chart pushes there can rise faster than planned.
These are historical third-party benchmarks, not live requirements. Use them to understand scale, then check the current chart in your target country.
Which chart should you target? A decision matrix
| Your situation |
Overall chart |
Category chart |
Keywords |
| Big brand or viral launch, very large budget |
✅ Consider |
✅ |
✅ |
| Mid-size app, clear category, moderate budget |
❌ |
✅ Best fit in mid-size or smaller countries |
✅ Run in parallel |
| Small app, limited budget |
❌ |
⚠️ Only in a smaller country or quieter category |
✅ Best fit |
| Shopping app in Black Friday week, US/UK |
❌ |
⚠️ Expensive; competitors are spending too |
✅ Deal-intent long-tail terms |
| Non-shopping app whose category spikes in the holidays (games, photo, productivity) |
❌ |
✅ Time the push for peak days |
✅ |
| App with low ratings or a weak product page |
❌ |
❌ Fix conversion first |
⚠️ Small scale only |
The pattern: category charts for a short, well-timed visibility window, and keywords for steady search traffic. Most apps should run both rather than pick one.
To see how chart visibility and keyword work fit together in one acquisition plan, see the boost app rankings and user acquisition solution.
What changes during Black Friday week?
Three things raise the bar at once:
- More competitors pushing at the same time. Retail and shopping apps increase spending in late November, so the Shopping chart threshold rises exactly when you want to be on it.
- Charts move faster. With more installs flowing, a position held on Monday can be gone by Thursday unless your install velocity keeps up.
- Spillover into nearby categories. Lifestyle, finance (budgeting, cashback) and photo apps often see seasonal surges too.
Practical rules for Black Friday chart pushes:
- Time the push for the days that matter. For Black Friday 2026 (November 27), that means roughly November 23–28. A push that peaks on November 20 will have faded by Friday.
- Pick your storefront deliberately. Holding a category Top 10 in a mid-size market is often worth more than sitting at #40 in the US.
- Keep a keyword layer underneath. Keyword rankings hold up better once the push ends.
How do you estimate the cost before you buy?
Use a simple formula:
Estimated cost = target installs per day × number of days × unit price
Then compare it with what the chart position is worth to you: extra organic installs from chart browsing, and how many of those users turn into revenue.
Illustrative example (Google Play, category chart, mid-size European country):
| Input |
Value |
| Installs per day to reach and hold the category Top 10 (from your own chart check) |
2,000 |
| Push window |
5 days (Nov 23–27) |
| Package install unit price, Google Play (base) |
$0.15 |
| Estimated cost |
2,000 × 5 × $0.15 = $1,500 |
The same push on iOS at $0.30 per install would cost about $3,000. That's why many teams push charts on Google Play in a smaller market and focus iOS spend on keywords.
Package installs are the usual tool for chart pushes. They start from $0.15 per install on Google Play and $0.30 on iOS (checked November 10, 2026), and unit prices drop as your cumulative spend reaches higher membership tiers.
A quick sanity check: if the estimated push costs more than a month of keyword work, or the chart position wouldn't bring at least a meaningful share of that cost back in organic installs, choose a smaller storefront, a quieter category, or keywords instead.
What's the alternative if chart pushes are too expensive?
Rank for what users search, not for what they browse.
- Choose 10–20 relevant keywords, including long-tail deal or seasonal terms (gift ideas, price tracker, holiday budget). The keyword selection guide shows how to balance volume, difficulty and chance.
- Support them with steady keyword installs over 1–2 weeks, from $0.20 on Google Play and $0.30 on iOS (checked November 10, 2026).
- Keep the run continuous on iOS, and allow about 7–9 days for Google Play rankings to settle.
Keyword traffic also tends to convert better, because the user typed something close to what your app does.
How do you check the current threshold yourself?
You don't need a paid tool to get a rough figure:
- Open the category chart in your target country and note the apps at #1, #10 and #50.
- Look up their estimated daily installs in any app-intelligence tool, or compare with apps whose numbers you know.
- Watch the chart for 3–5 days at the same time each day. A stable chart means you need steady velocity; a fast-moving one means a short push can work.
- Check whether the apps above you are seasonal. If they are, the threshold will fall soon after the holiday.
Write the result down next to your cost estimate before you place any order.
Common chart-push mistakes
- Aiming for the overall chart with a category-chart budget. The gap is usually several times larger.
- Pushing in the US because it's the default. A smaller market where you can hold the Top 10 often pays back better.
- Peaking before the important days. Chart position fades within days.
- Ignoring conversion. A chart push sends browsing users to your page. If it doesn't convert, you pay for views that don't turn into installs.
- Stopping abruptly. Taper after the peak days to soften the drop, and keep keywords running underneath.
FAQ
What's the difference between the top chart and a category chart?
The overall top chart ranks every app in the store, so it's dominated by the biggest brands. A category chart ranks only apps in the same primary category, which makes it far more realistic for most apps.
How many downloads do you need to reach the top 10 on the App Store?
Historical US iPhone data (Sensor Tower, 2019) put the overall Top Free Top 10 at around 49,000 downloads a day for non-game apps. Category Top 10s needed roughly 12,000–16,000 in popular categories. Current requirements vary by country, category and season.
Is it easier to rank in a category chart in smaller countries?
Usually, yes. Fewer competing apps and lower install volumes mean a much lower threshold. Smaller storefronts can react within one to three days.
How long does a chart position last after a push?
Not long. Chart rank depends mainly on recent install velocity, so positions usually fade within days after installs drop. Plan a short window and taper afterwards.
Should a shopping app push the chart during Black Friday?
Only with a realistic budget and a clear plan for converting that traffic. Competition peaks that week, so many shopping apps get more from deal-intent keywords or a less competitive storefront.
Is it better to invest in keyword rankings or chart rankings?
For most apps, keywords give steadier, better-converting traffic, while category charts give a short visibility boost. A combination works best: keywords as the base layer, and a well-timed category push for peak days.
 COVID-19 UPDATE