COVID-19 UPDATE


Important Notice:Beware of scams using ASOWorld's name for part-time recruitment or ASO earning app activities. ASOWorld is not hiring any part-time staff. Trust only official information posted by ASOWorld.

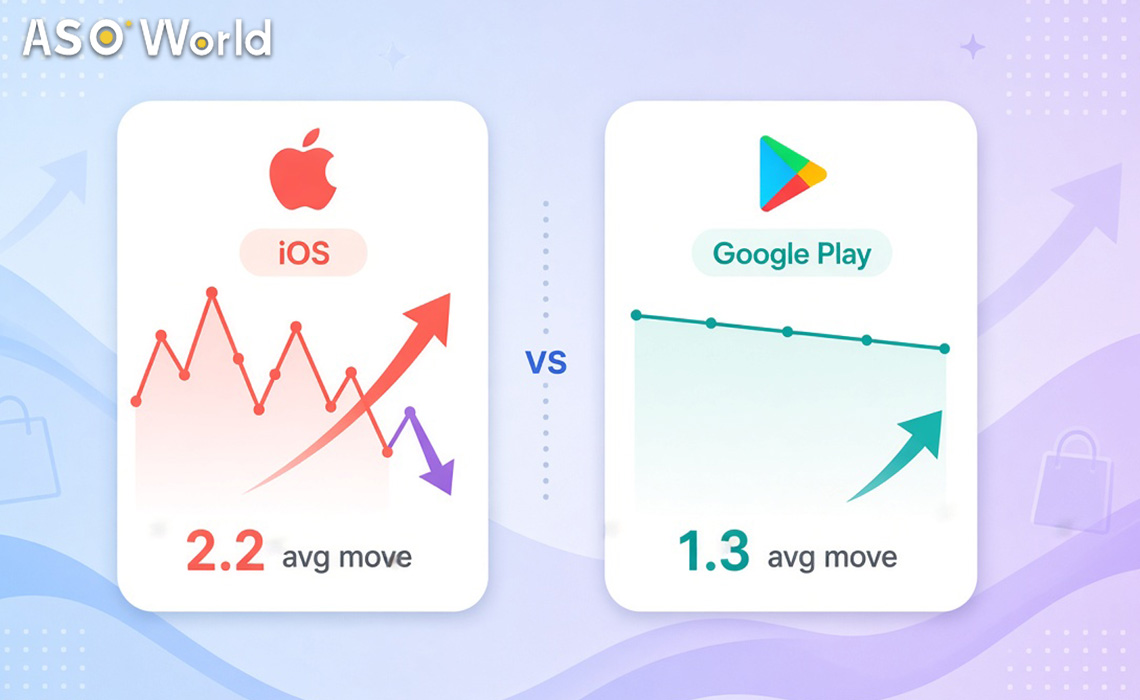
iOS ranks moved 1.7× more than Google Play around Black Friday 2025. Compare daily volatility, top-10 turnover and what a top-10 seat cost on each store.


Key numbers
All figures come from FoxData rank records and download estimates; method and caveats are in "About the data".
If you run the same Black Friday campaign on both stores, you are assuming they behave the same way. The 2025 data says they don't. This analysis compares the same 18 brands on both US Shopping charts across the Black Friday window and turns the differences into a budget plan.
We picked 18 shopping brands that chart on both stores in the US (Temu, Amazon, Walmart, Best Buy, SHEIN, Target, Lowe's, Old Navy, Macy's, Home Depot, Costco, Kohl's, Wayfair, eBay, Etsy, AliExpress, Shop and Capital One Shopping). We pulled each one's daily category rank from November 3 to December 5, 2025, covering the pre-node baseline, Black Friday on Nov 28 and Cyber Monday.
| Metric (US Shopping free chart, Nov 3–Dec 5, 2025) | iOS | Google Play |
|---|---|---|
| Mean absolute daily rank change | 2.2 positions | 1.3 positions |
| Share of days with ≥5-position jumps | 14% | 6% |
| Largest single-day jump observed | 33 (Old Navy, #37→#4) | 14 (Old Navy, #48→#34) |
| Tracked top-10 turnover, Nov 3 → BF day | 4 of 10 slots | 2 of 10 slots |
Source: FoxData per-app rank records, 18 matched brands | iOS Shopping (genre 6024) / Google Play "Shopping" free charts | US
The pattern isn't driven by one outlier. On iOS, Kohl's moved 5.3 positions a day on average and jumped 5+ positions on 41% of days; Old Navy moved 6.1 a day with jumps on 44% of days; Lowe's swung 21 positions in a single day (Nov 27→28). The same brands on Google Play: Kohl's 2.0 and 9%, Old Navy 2.8 and 19%, Lowe's 7 positions at most. Temu held #1 on Google Play for all 33 days; on iOS it held #1 for most of the window but dipped to #4 twice.
What this means for your app: an iOS chart position needs active support (install velocity, ratings, updates) just to stay where it is, especially in the node window. A Google Play position, once gained, tends to decay more slowly. Your monitoring cadence and budget split should reflect that.
Volatility averages understate what the node does to chart membership. On iOS, four tracked apps entered the BF-day top 10 from outside it three weeks earlier: Lowe's (#31→#1), Best Buy (#21→#2), Old Navy (#37→#4) and Target (#12→#8). On Google Play the same window admitted two: Best Buy (#20→#9) and Etsy (#15→#10).
| BF-day rank (US, Nov 28, 2025) | iOS app (rank on Nov 3) | Google Play app (rank on Nov 3) |
|---|---|---|
| 1 | Lowe's (#31) | Temu (#1) |
| 2 | Best Buy (#21) | Walmart (#5) |
| 3 | Temu (#1) | AliExpress (#2) |
| 4 | Old Navy (#37) | Amazon (#6) |
| 5 | Shop (#6) | SHEIN (#7) |
| 6 | Walmart (#4) | Shop (#9) |
| 7 | Amazon (#3) | untracked |
| 8 | Target (#12) | untracked |
| 9 | Capital One Shopping (#7) | Best Buy (#20) |
| 10 | SHEIN (#5) | Etsy (#15) |
Source: FoxData rank records | "untracked" = slots held by apps outside our 18-brand set (Google Play's full chart list wasn't retrievable; membership derived from per-app curves)
The door swings both ways. By December 5, the iOS top 10 had reshuffled again (Shop #1, Temu #2, Capital One Shopping #3), while Google Play's Dec 5 top 10 still contained seven of its BF-day members.
What this means for your app: on iOS, a Black Friday push can buy a top-10 seat (four brands did it in 2025), but plan for the decay the following week. On Google Play, the node mostly rewards apps that are already big; a new top-10 entry is rarer and needs a longer runway.
Using download estimates for the ten apps that held each store's BF-day top 10:
| Store | BF-day top-10 threshold (est. daily downloads) | Notes |
|---|---|---|
| iOS | min 16,472 · median ~43,300 · max 55,332 | all 10 apps estimated |
| Google Play | min 12,465 · median ~27,100 · max 75,042 | 8 of 10 tracked; 2 slots unestimated |
Source: FoxData download estimates, US, Nov 28, 2025 | per-app estimates are not strictly monotonic with rank
Look at the shape, not just the level. iOS's minimum (Best Buy, ~16.5K) sat far below its median, which suggests chart position isn't driven by download volume alone, or that estimates are noisy at the brand level. Google Play's maximum (Temu, ~75K) dwarfed its median because the #1 slot concentrates volume. Plan with the medians, and treat both as 2025 baselines.
What this means for your app: if your US organic baseline is under ~10K downloads a day, a top-10 Shopping seat on either store would require adding five-figure daily volume during the node, when everything costs more. The more realistic target is the adjacent band: current top-25 baselines run about 61K downloads a week on iOS (#24) and ~22.5K a week on Google Play (#25) (FoxData estimates, Oct 23–29, 2026). Keyword rankings in the top 5 for deal-intent terms are cheaper still.
Ranking the tracked set by average daily movement makes the store gap concrete:
| Brand | iOS mean daily move | iOS days with ≥5 jump | iOS max jump | GP mean daily move | GP max jump |
|---|---|---|---|---|---|
| Old Navy | 6.1 | 44% | 33 | 2.8 | 14 |
| Kohl's | 5.3 | 41% | 22 | 2.0 | 7 |
| Lowe's | 3.8 | 25% | 21 | 1.2 | 7 |
| Macy's | 3.3 | 25% | 14 | 2.2 | 13 |
| Best Buy | 2.2 | 19% | 11 | 1.2 | 5 |
Source: FoxData per-app rank records, US Shopping free charts | Nov 3–Dec 5, 2025
All five of the most volatile iOS apps were brand retailers, the group whose demand concentrates on the node, and every one moved far less on Google Play. Temu sits at the other end: 0.6 average daily movement on iOS and zero on Google Play, where it held #1 throughout.
The aftermath is just as instructive. Lowe's went #31→#1→#12→#33 within about a week of the node, and Best Buy's #2 slipped to #13 by December 5. On iOS, the node behaved like a short burst; on Google Play, it behaved more like a slow tide.
What this means for your app: treat iOS volatility as a risk to hedge (velocity floors, review momentum, same-day monitoring) and Google Play stability as an asset to build (steady installs whose rank carries into December). The same budget buys different outcomes on each store.
Neither Apple nor Google publishes how category charts are calculated, so we avoid causal claims. Three explanations are consistent with the data, and all three are hypotheses:
What this means for your app: whatever the cause, the practical response is the same. On iOS, have ratings and install momentum in place before Nov 24, because on the day itself everything is more expensive. Pre-positioned guaranteed reviews (more than 80% expected to stay for 30 days, or refunded, per ASOWorld's page) help the rating hold during swing days. On Google Play, sustain install quality through Cyber Week, when iOS decays but Google Play's top 10 tends to stay put. A two-store keyword ranking strategy starts from that split.
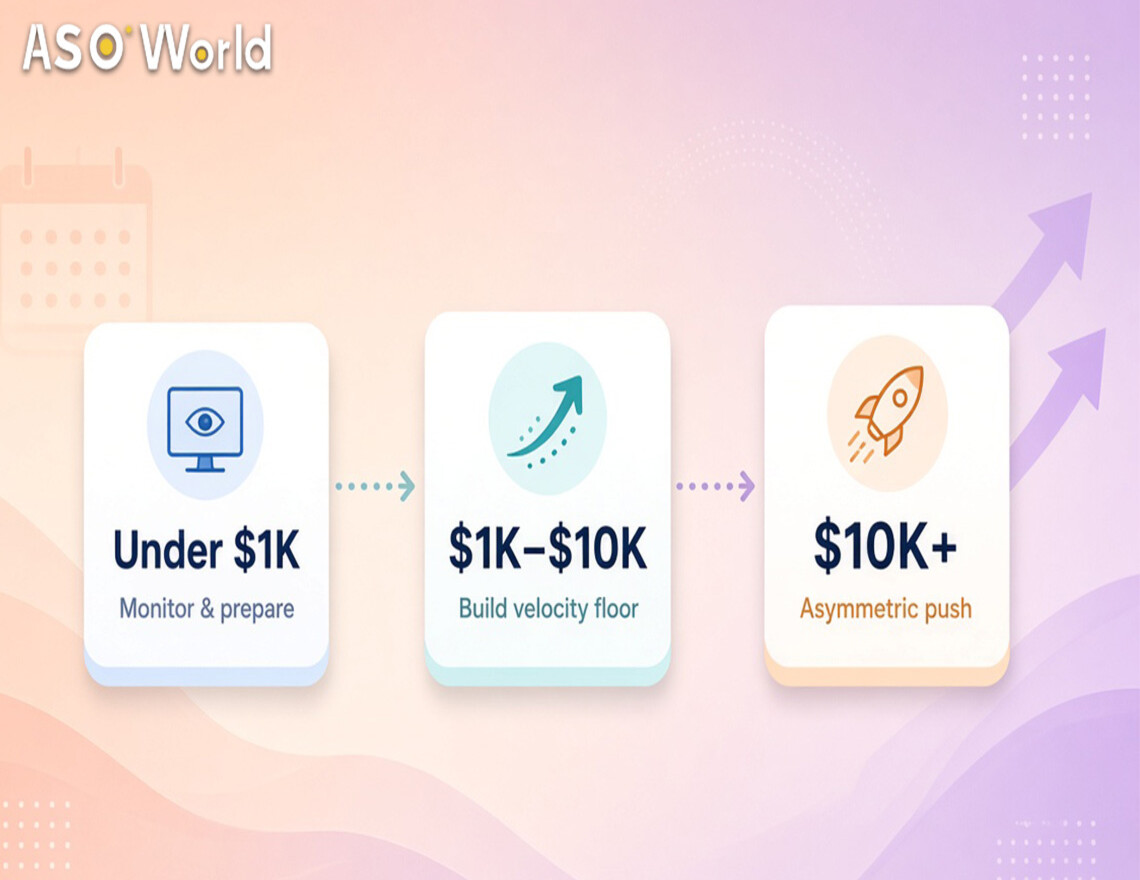
Tier 1 – under $1,000. Treat iOS volatility as an early-warning system. Monitor daily from Nov 17 and pre-write two promotional text variants (pre-node and node-day) so you can respond to a rank dip within hours without waiting for App Review. Refresh your keyword field on the terms that actually move your category.
Tier 2 – $1,000–$10,000. Build a velocity floor on iOS: phased keyword installs across the last two weeks of November, sized to hold your current keyword positions rather than chase category charts, plus review support on iOS, where swing days concentrate. Keep daily volumes close to your organic baseline; a sudden multiple of normal traffic is exactly the pattern store fraud systems look for.
Tier 3 – $10,000+. Run an asymmetric two-store campaign. On iOS, a surge targeting Nov 24–28 with package installs (currently from $0.24 per iOS install, discounted from $0.30; check the page for live pricing) to move from the top-25 band toward the top 10. On Google Play, a sustain program through Dec 5 to hold what you win. This approach suits apps that already have a large organic base; for everyone else, the boost app rankings and user acquisition approach focuses on category and keyword positions you can realistically hold.
For the full spend math, see the Black Friday ASO budget playbook. For timing seasonal keywords by market, see When do Black Friday keywords start climbing?.
Which store's rankings are more stable, iOS or Google Play?
In our 33-day, 18-app US Shopping tracking around Black Friday 2025, Google Play: average daily rank movement of 1.3 positions vs 2.2 on iOS, with 5+ position jump days at 6% vs 14%.
What was the biggest Black Friday rank jump in 2025?
Old Navy on the US iOS Shopping chart: #37 to #4 on Black Friday, 33 positions in one day. Its largest Google Play move in the same window was 14 positions.
How many downloads did a US iOS Shopping top-10 seat take on Black Friday 2025?
An estimated median of ~43,300 downloads that day across the ten charting apps (min 16,472, max 55,332). Google Play's median across 8 tracked apps was ~27,100.
Do Black Friday chart gains last?
On iOS, mostly not. By December 5, 2025 the top 10 had reshuffled and Lowe's had fallen back to #33. Google Play's BF-day top 10 kept seven members through Dec 5.
Why is Google Play's chart calmer?
Neither store publishes its chart formula. Plausible explanations include stronger recency weighting on iOS and broader quality and engagement signals on Google Play, but these are hypotheses, not confirmed mechanics.
Is it easier to chart on Google Play?
The entry threshold was lower (median ~27K vs ~43K daily downloads on BF day), but admission was rarer: 2 of 10 slots turned over vs 4 on iOS. A lower door, but fewer doors.
 App Store Optimization,Google Play Ranking Algorithm,
Get FREE Optimization Consultation
Let's Grow Your App & Get Massive Traffic!
All content, layout and frame code of all ASOWorld blog sections belong to the original content and technical team, all reproduction and references need to indicate the source and link in the obvious position, otherwise legal responsibility will be pursued.