COVID-19 UPDATE

Important Notice:Beware of scams using ASOWorld's name for part-time recruitment or ASO earning app activities. ASOWorld is not hiring any part-time staff. Trust only official information posted by ASOWorld.

Trends in the mobile gaming markets in 2022 is based on the study of the top 2,500 apps in the app store, revealing key trends in the gaming vertical.


A lot is happening across the mobile app market in 2021, with massive privacy changes affecting iOS user acquisition, dramatic shifts and impressive growth in consumer habits and user behavior patterns.
What we’re talking about today about trends in the mobile gaming markets in 2022 is based on the study of the top 2,500 apps in the app store, revealing key trends and benchmarks in the gaming vertical, providing actionable insights for mobile app advertisers Insights to drive better growth in app gaming in 2022.
Some data worth paying attention to:
● Year-over-year app install growth across all tracked verticals and regions in 2021, 35% fintech, 12% e-commerce, and 32% gaming.
● Hyper-casual games account for the highest proportion of installations in the gaming vertical (27%), but action games (30%) account for the largest proportion of games.
● Fintech, e-commerce and gaming all had their highest in-app revenue months on record in 2021.

Click "Learn More" to drive your apps & games business with ASO World app promotion service now.
Mobile gaming has been growing year over year for over a decade and appears to continue to soar. From hyper-casual to experiential role-playing strategy games, game promotion teams are unique in how they do marketing, advertising, and how they monetize their games.
Hyper-casual games rely more on mass installs, cross-promotion of properties in the same release suite, and rewarded videos, while strategy games focus more on mining higher lifetime value, finding users with a lot of session time per day, willing to spend big on in-game items and stay royal to a single title.
Looking at the 2021 revenue data, the biggest revenue for the mobile gaming market is from games in these two categories, and everything in between, which shows the versatility of mobile gamers, and some game promotion teams It is successful in target user analysis and user operation.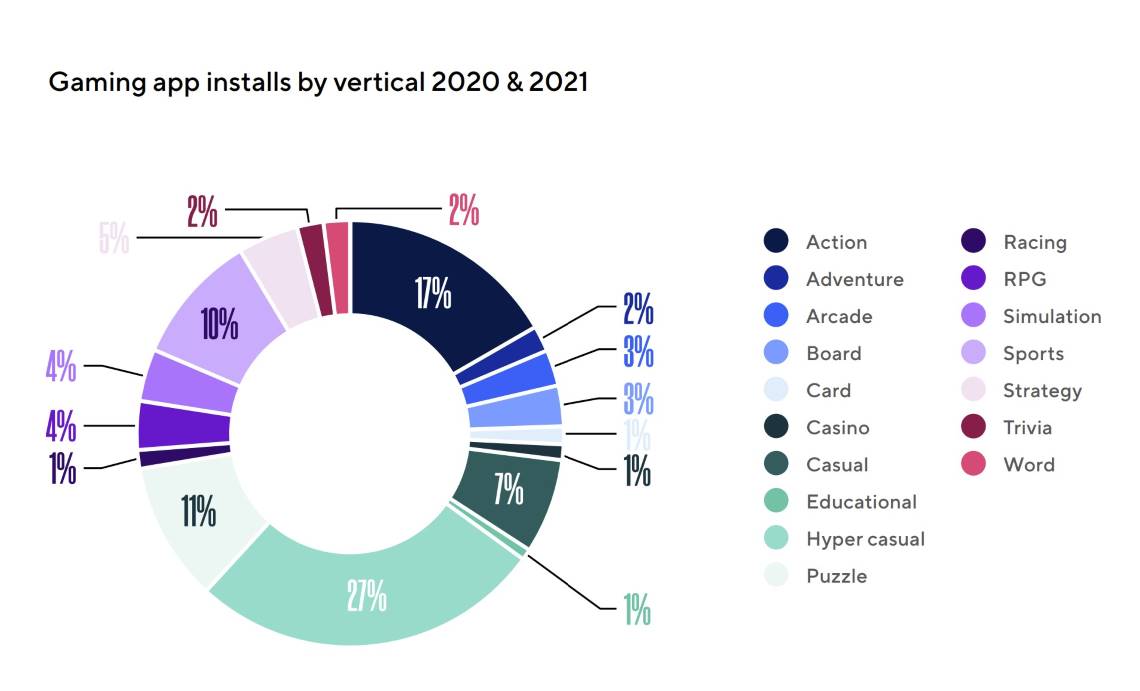
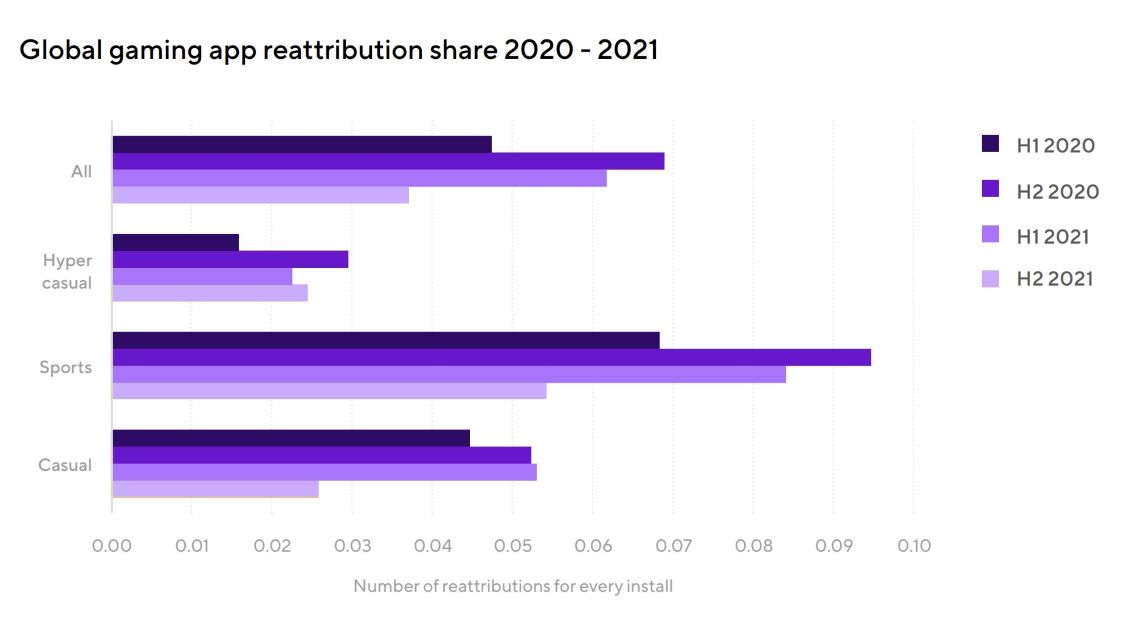
Low reattribution rates across the gaming vertical in 2021 suggest that amplified UA activity favors new users and new installs. While game reattribution has never been this high, the drop from ~0.05 to ~0.04 is still notable.
Global sessions in the gaming market haven’t soared as much as installs, growing only 2% in 2021. But if we compare the Q2-Q3 2020 average to the 2021 average, the growth rate climbs to 15-20%, a figure that's almost on par with the pandemic's growth rate.
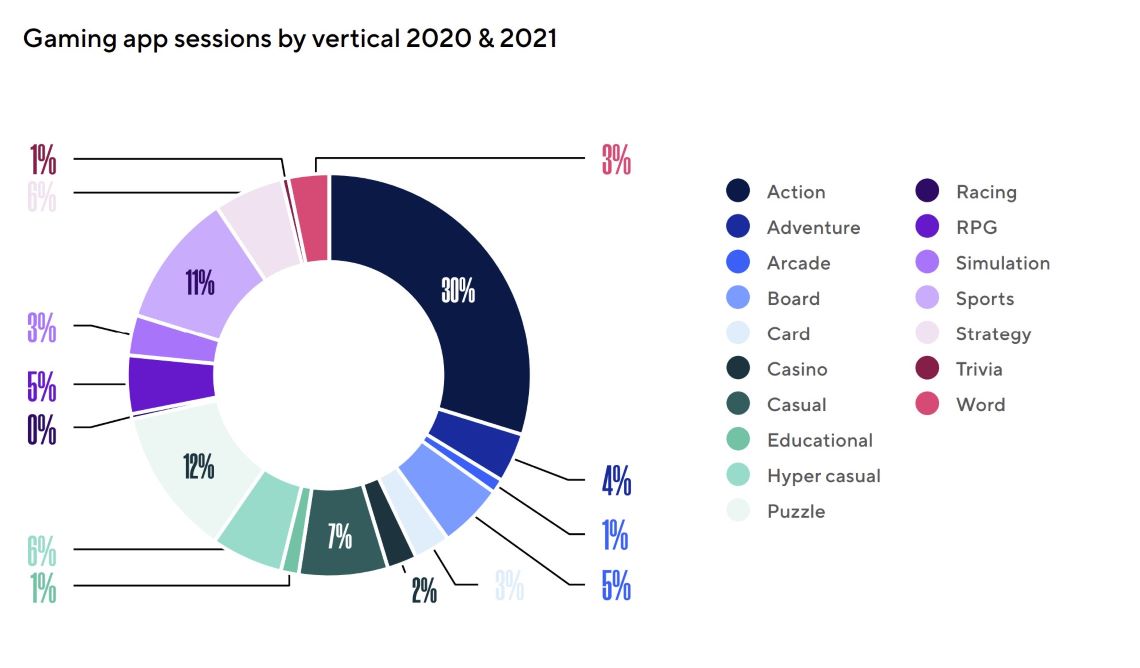
The distribution of these sessions across categories/subcategories shows that installs do not always directly correlate with session count. Hyper-casual games, which accounted for 27% of installs, accounted for only 6% of total sessions. Action games accounted for the largest share at 30%, followed by puzzle games (12%), sports games (11%) and strategy games (6%).
Compared with 2020, the number of daily sessions of game users in 2021 also increased in general, with the first half of 2021 being the period with the highest number of sessions.
In early 2020, sessions per user per day were 2.21 on day 1, 2.18 on day 14, and 2.24 on day 30. In the first half of 2021, it increased to 2.26 on day 1, 2.25 on day 14, and 2.29 on day 30.
With day 30 rates consistently higher than day 1 rates, game user retention rates are very high, showing how skilled UA teams in this vertical are at finding, targeting, acquiring, and retaining users.
The total time spent in apps per user over a 24-hour period also increased in 2021, peaking in the first half of the year. The total application time increased from 50.3 minutes to 53.3 minutes on day 1, from 44.9 to 47.2 on day 3, from 43.3 to 45.5 on day 7, from 41.7 to 44.2 on day 14, and from 41.1 to 43.0 on day 30 . User acquisition is expensive, but session length and frequency are increasing, creating more opportunities for these loyal users.
Top gaming takeaways:
Global installs of gaming apps increased 32% year-over year in 2021.
Hyper casual games makes up the highest share of app installs (27%), while action games accounts for the largest proportion of sessions (30%).
Session lengths, sessions per user per day, and time spent in-app all increased in 2021.
From the analysis and tracking of the key indicators in the app market, including app installs, sessions, ATT opt-in rate, user retention, re-attribution, etc., the discovery of some mobile game industry trends can help game application marketers better learn about their target audience and the current condition of the app markets.
Looking at the overall data about the mobile app market in 2021, the growth in the key metrics has been impressive, indicating an influx of highly engaged users. In addition to the huge improvements, we can see that app user retention condition is lagging a bit, but user retention and LTV are all very important as UA for app growth.
 Mobile Growth,Mobile Analytics,
Get FREE Optimization Consultation
Let's Grow Your App & Get Massive Traffic!
All content, layout and frame code of all ASOWorld blog sections belong to the original content and technical team, all reproduction and references need to indicate the source and link in the obvious position, otherwise legal responsibility will be pursued.