COVID-19 UPDATE

Important Notice:Beware of scams using ASOWorld's name for part-time recruitment or ASO earning app activities. ASOWorld is not hiring any part-time staff. Trust only official information posted by ASOWorld.

Insights focus on the financial apps industry trends and the targeted users' behavior, to help marketers to get a better app growth for their financial apps.


2021 is full of challenges for the fast-growing world of app marketing. From recent app and game industry trends, we have been paying attention to changes in user habits and preferences. We see more and more users turning to apps for entertainment, information, and basic everyday tasks, and the global shift to mobile devices continues.
Respond to broad shifts in consumer patterns and user habits brought on by the COVID-19 pandemic, including ongoing lockdowns and social distancing rules. New challenges are emerging, and user privacy spearheaded by iOS 14.5, which was launched in April, is also in the spotlight.

Click "Learn More" to drive your apps & games business with ASO World app promotion service now.
Despite these challenges, the mobile app ecosystem continues to thrive, a testament to the robustness and adaptability of the app marketing industry, as well as the ability of advertisers and developers to find and retain audiences in global markets.
Consumer spending on mobile apps will reach $170 billion in 2021, and ad spending will also hit a record $288 billion, which is expected to grow to $336 billion in 2022.
As the reach of consumers expands and the quality of services offered continues to exceed expectations, with no sign of slowing down, there are many revolutionary changes to the top apps to meet diverse needs.
In 2022, competition is fierce, but opportunities multiply. For marketers, gaining the insights needed to drive performance through analytics and gaining a complete picture of your audience with actionable data are key prerequisites for making your app stand out.
We'll focus on the financial apps industry trends and the targeted users' behavior, to help marketers to get a better app growth for their financial apps.
Some data below need to be take care for your app growth:
Banking app revenue to reach $6.8 billion in 2021, up 88% from 2020.
In the US alone, financial app downloads reached 573.1 million, a 19% increase from 2020.
In 2021, more than half of all purchases (52%) will be made using digital wallets, and cash usage has declined by 42% since 2019.
The top use of fintech applications cited by North American users in 2021 is paying bills, followed by banking, filing taxes, sending money to friends, investing, and buying and selling cryptocurrencies.
China is the global leader in mobile proximity payments with an 87% adoption rate. India accounted for 40%, South Korea 46%, and the United States 43%.
In recent data on the mobile app market we surveyed, app installs ranked among the top categories, with fintech up 35%, e-commerce up 12%, and gaming up 32%.
Stock trading and crypto apps accounted for 7% and 2% of all fintech app installs, respectively, but 17% and 6% of sessions.
Globally, installs of fintech applications increased by 35% year-on-year in 2021, with the largest increase in November, up 26% compared to the 2021 average and 82% compared to 2020.
Growth can also be seen in other parts of the world. North America tops the list with a 69% year-over-year increase in financial app installs in 2021. Latin America also surged 62%, Asia Pacific grew 29%, and EMEA grew an average of 16%.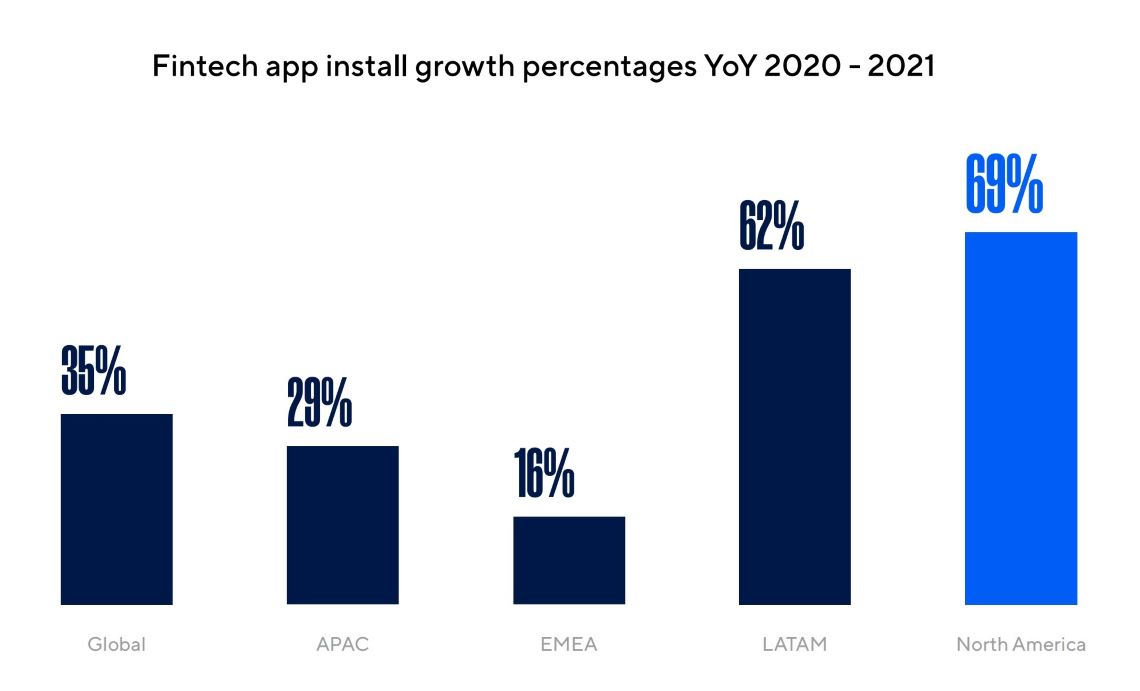
From the breakdown data of the survey, the global distribution of the installed amount of financial apps, among which payment applications account for about 57% of the installed share, followed by banking apps, accounting for 34%, and stock trading applications accounting for 7% of the installed share, and encryption apps accounts for 2%.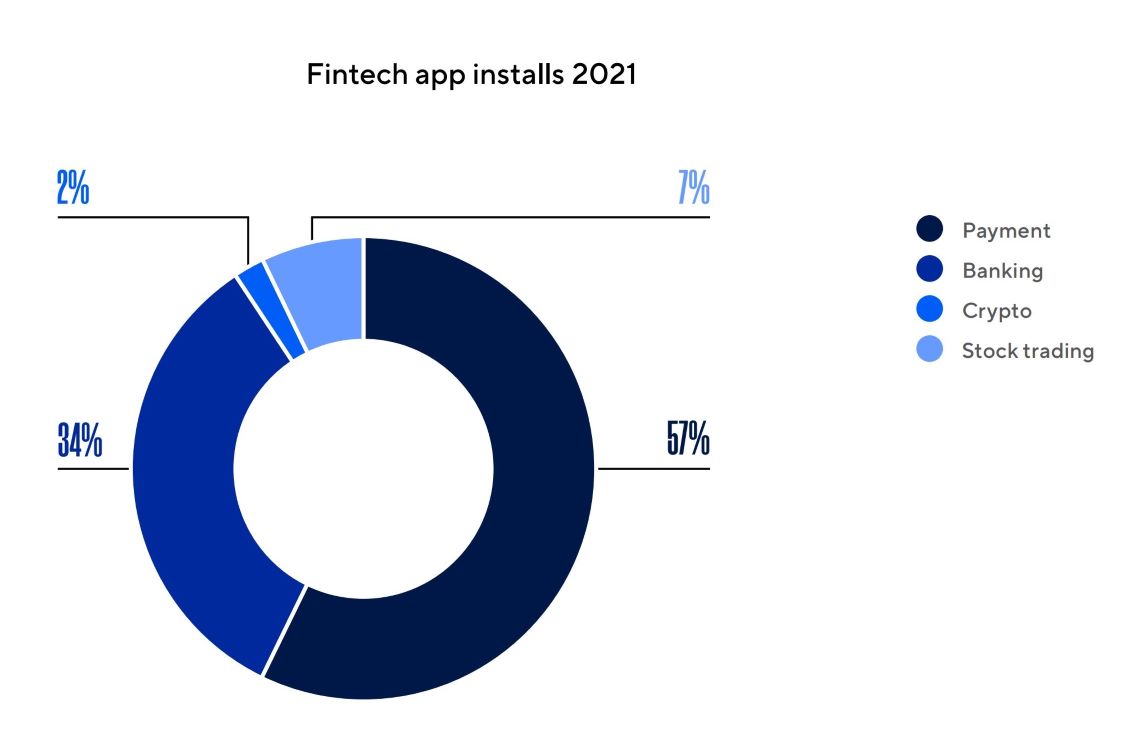
Coinciding with the huge growth in interest and the trend of attracting more users in more diverse sub-sectors, the average eCPI of fintech applications has increased sharply.
Starting at $1.05 per installation in the first half of 2021, the average price skyrockets to $3.40 in the second half of 2021. As more and more players enter the field and the cost of acquiring users continues to increase, the acquisition of high-value users and the improvement of old users retention have become an important topic for app marketers.
According to the latest data, user sessions on fintech applications are growing rapidly, increasing by 53% globally. This indicates increased engagement among fintech app users, as existing and newly acquired users are having more sessions than ever before. While the global trading session continued its upward trend throughout the year, the highest point came in April, 27% higher than the rest of 2021.
Looking at the user session amount for fintech apps worldwide, Latin America and North America led the growth with 128% and 111% respectively. Asia Pacific also saw an impressive 59% growth, followed by EMEA with 12% growth.
Judging from the segmentation data of the fintech app market, in terms of user sessions, banking apps ranked first with a proportion of 46%, followed by payment apps, accounting for 31%. Stock trading apps and encryption apps accounted for more sessions than installs, at 17% and 6%, respectively, suggesting that users who download apps in these categories have more sessions than most users in the banking and payments space.
Global fintech app installs and sessions grew by 34% and 53%, respectively.
Globally, the fintech app market has seen varying degrees of growth, with LATAM up 62% in installs and 128% in sessions. North America saw a 69% increase in app installs and a 111% increase in sessions.
 Mobile Growth,Mobile Analytics,
Get FREE Optimization Consultation
Let's Grow Your App & Get Massive Traffic!
All content, layout and frame code of all ASOWorld blog sections belong to the original content and technical team, all reproduction and references need to indicate the source and link in the obvious position, otherwise legal responsibility will be pursued.