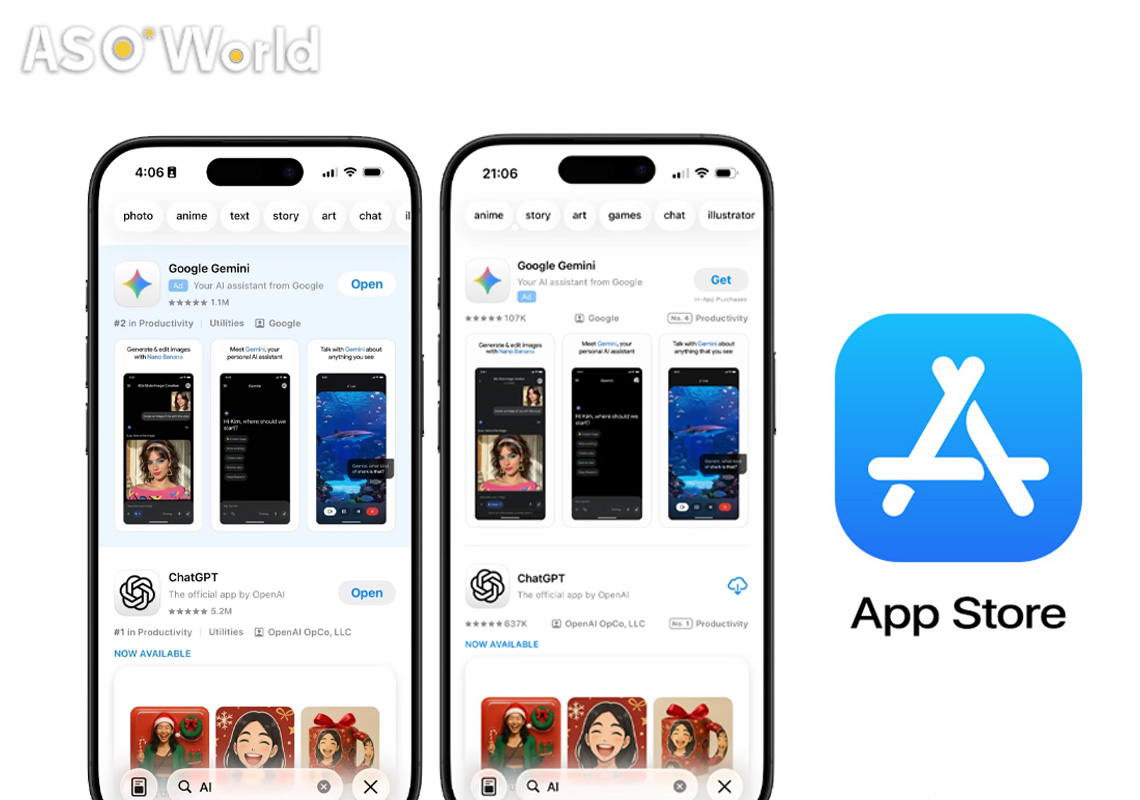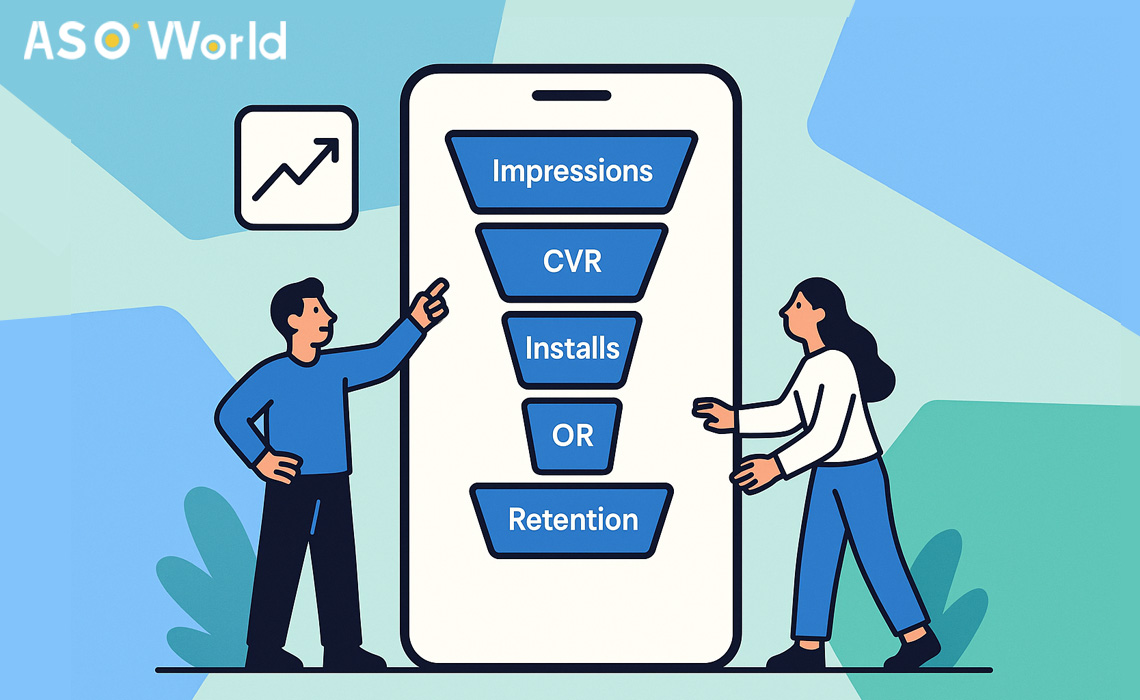
For years, App Store Optimization (ASO) has revolved around visibility: gaining impressions through keywords, rankings, and category exposure. While impressions are the starting point of discovery, they tell only part of the story. In a competitive marketplace where thousands of apps vie for user attention, the real challenge is not just being seen, but converting visibility into meaningful engagement.
This is where conversion rate (CVR) and open rate (OR) enter the picture. These two metrics provide a deeper look at user behavior, bridging the gap between discovery and sustained app usage. By combining traditional ASO practices with controlled CVR and OR experiments, app teams can move beyond guesswork and base their growth strategies on measurable user responses.
Why Impressions Alone Are Not Enough
Impressions show how many people have seen your app in the store, but they do not indicate whether users are motivated to install or engage. An app with high impressions but low installs may have strong visibility but weak appeal. Conversely, an app with modest impressions but strong installs may be targeting the right audience more effectively.
This is why impressions should always be contextualized with downstream metrics. Without conversion or engagement data, impressions can create a false sense of security, encouraging teams to celebrate exposure rather than results.
Understanding Conversion Rate (CVR)
CVR measures how effectively impressions translate into installs. It answers the critical question: “Of the users who saw the app, how many decided it was worth downloading?”
- High CVR suggests that the app store listing resonates with the audience. Factors such as compelling icons, screenshots, engaging descriptions, and strong ratings typically drive higher conversion.
- Low CVR may signal misaligned keyword targeting, weak creative assets, or unmet user expectations.
In practice, CVR is not a static number but a dynamic signal. By monitoring how CVR shifts after design updates, keyword changes, or seasonal campaigns, developers gain insight into what resonates with their target users.
The following table provides experience-based reference ranges for natural conversion rates observed across app categories. Treat these as industry reference points — actual rates vary by market, audience, geography, and campaign specifics.
| App category (CVR reference) |
Typical natural CVR range |
Notes |
| Utility / Productivity (Tools) |
20% – 40% |
Often higher CVR because users search for and download to solve a specific task. |
| Game |
15% – 30% |
Wide variance: casual/mobile games may be lower on average; hit titles and seasonal promotions increase CVR. |
| Finance / Social |
10% – 20% |
Often lower CVR due to higher trust/verification barriers (finance) or specific social network effects. |
Expert Tips: these percentages are practical reference ranges used for planning experiments and are not guarantees. Use them to set hypothesis thresholds for controlled CVR testing.
Beyond traditional testing, a controllable CVR service allows developers to set conversion ratios that match their app category and growth objectives. This makes performance data more aligned with natural market patterns and reduces the risk of algorithmic penalties caused by abnormal spikes.
- Better compliance with store algorithms, leading to more stable long-term growth.
- The ability to simulate different conversion scenarios and optimize future campaign strategies.
- Avoiding wasted budget from short-term anomalies.
Professional providers such as ASOWorld offer the services to help teams run controlled experiments in a safer, more predictable way.
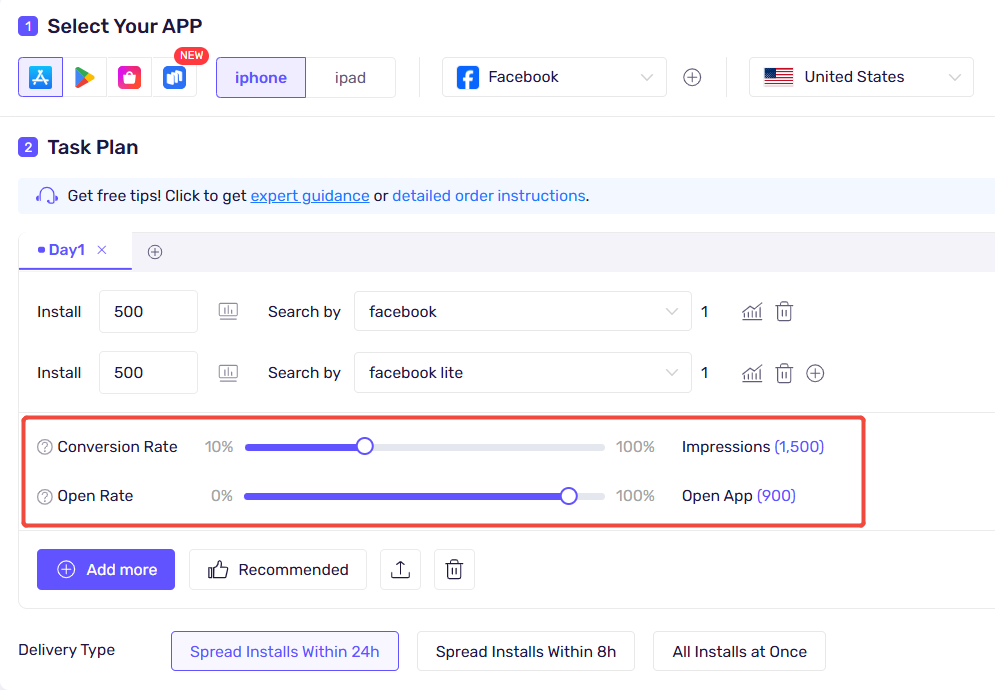
ASOWorld effect example image
Moving Beyond Installs with Open Rate (OR)
An install is only the beginning. Many users download apps they never open, leading to inflated install counts that contribute little to retention or revenue. Open rate (OR) addresses this gap by tracking how many installers actually launch the app.
- A healthy OR indicates that the app not only caught user attention but also motivated them to explore its content.
- A low OR highlights a disconnect: perhaps the app store listing overpromised, the onboarding flow created friction, or the traffic source delivered unqualified users.
By combining CVR with OR, teams can measure not just how many people download, but how many take the crucial first step toward becoming active users.
The table below shows common open-rate bands and short explanations for each category. These ranges are practical benchmarks to help interpret OR performance and prioritize experiment design.
| App type |
Typical open-rate range (OR) |
Explanation |
| Utility / Productivity |
5% – 15% |
Users often use these apps when needed; usage frequency is regular but tied to specific tasks, so OR is stable but moderate. |
| Game |
5% – 20% |
Large variance — popular or event-driven titles can see high OR, while casual/novelty games often have lower OR. |
| Finance / Banking |
5% – 10% |
Usage is task-driven (transactions, balances), frequency depends on user needs and trust. |
| Social / Messaging |
10% – 25% |
High stickiness for communication apps; daily active usage is typical for many social platforms. |
| E-commerce / Shopping |
3% – 10% |
Dependent on promotions and seasonal activity; everyday open rates tend to be lower. |
| Health / Fitness |
5% – 15% |
Usage often tied to routines or scheduled workouts, with moderate daily/weekly engagement. |
| Media / Content |
5% – 20% |
Heavily content-driven; highly engaging offerings can push OR above 20%. |
Expert Tips: OR is strongly influenced by onboarding quality, perceived value at first open, and the match between listing promises and in-app experience. Use these ranges to set realistic goals for onboarding and early retention experiments.
Similarly, our controllable OR service enables developers to determine realistic open-rate ranges based on app type and expected engagement. This creates usage patterns that look more natural and reflect true user journeys.
Benefits include:
- Simulating authentic user behavior, which improves app activity metrics.
- Enhancing overall performance, including retention and ratings.
- When combined with controllable CVR, it delivers full-funnel optimization — from impression to install to real usage.
The Power of Controlled CVR/OR Experiments
Traditional ASO practices—such as keyword research, screenshot testing, and competitor analysis—remain essential. However, these methods often rely on observational data, which can be noisy and difficult to interpret. Controlled CVR and OR experiments add a scientific layer to ASO, offering reliable ways to test hypotheses.
Examples of controlled experiments include:
- Creative testing: Running A/B tests on different screenshot sets to measure which design produces higher CVR.
- Keyword validation: Assessing whether installs driven by certain keywords yield higher OR, helping identify which queries bring genuinely interested users.
- Onboarding impact studies: Simulating early user behavior to see whether changes in the first-run experience improve OR.
Unlike one-off promotional campaigns that may inflate numbers artificially, controlled experiments replicate realistic user behavior. This ensures that the results reflect how genuine users would respond, preserving data integrity and compliance with platform policies.
Common Pitfalls and How to Avoid Them
1. Chasing installs alone
Focusing exclusively on installs overlooks whether users actually open and engage with the app. High install counts without follow-up activity often lead to disappointing retention.
2. Relying on inflated metrics
Artificially boosting impressions or installs can trigger platform safeguards and undermine long-term ranking signals. What seems like a quick win may damage trust and growth potential.
3. Neglecting post-install data
Without monitoring OR, teams may misinterpret growth. A marketing campaign that increases installs but fails to improve OR may be driving volume without value.
Conclusion
In the evolving world of app marketing, impressions will always matter—but they are only the beginning of the story. CVR and OR reveal the quality of those impressions, showing whether users are truly compelled to install and explore an app. By adopting controlled experiments around these metrics, developers and marketers can make smarter choices, reduce risks, and achieve sustainable growth.
If you'd like to validate your app's funnel with realistic CVR and OR experiments, ASOWorld's professional guidance can help design compliant tests that mirror natural user behavior while producing reliable insights.
Notes on the inserted tables: the CVR and OR ranges provided are experience-based reference points intended to inform hypothesis setting and experiment design. Actual performance will vary by country, acquisition source, seasonality, and product maturity — use these bands to prioritize which tests to run and to set realistic targets for controlled experiments.
 COVID-19 UPDATE