noticeCOVID-19 UPDATE ASO World entire team is working remotely. we expect no disruptions in our ASO services.
Browser close
50% OFF FIRST ORDER
Referral Program
bonusprogram
50% OFF FIRST ORDER
Referral Program
bonusprogram
logo
  • アプリプロモーションサービス
    キーワードインストール
    パッケージ名によるインストール
    評価とコメント
    良質なコメントサービス
    キーワードを保証するランキングサービス
    ASO仕える
    カスタマイズソリューション
    その他のサービス
  • ASO ツール
    無料ASOツール
    キーワードリサーチツール
    キーワードの選び方
    promote
    すべての季節を成長の急上昇に変える
    FIFAワールドカップから夏の需要急増、ブラックフライデーからクリスマスまで――あらゆるピークシーズンは、すでに競合が狙っているユーザー獲得のチャンスです。出遅れないでください。
  • ソリューション
    By vertical
    スポーツ
    HOT
    人工知能アプリケーション
    健康と運動
    eコマース
    フィンテック
    HOT
    ゲーム
    教育
    デート
    エンターテイメント
    トラベル
    ソーシャルメディア
    レストランとフードテック
    生産性
    Lifestyle
    音楽
    効用
    写真とビデオ
    Casino
    Business
    ニュース
    NEW
    By Performance
    季節&イベントマーケティング
    NEW
    FIFA ワールドカップ 2026 アプリ成長戦略
    HOT
    アプリの評判とネガティブレビュー管理
    アプリのランキングとユーザー獲得を向上
    NEW
    オーガニックコンバージョンとユーザーエクスペリエンスの向上
    NEW
    モバイルアプリのローンチマーケティング
    NEW
    キーワードランキングとオーガニックダウンロードを増やす
    NEW
    solution-suffix
    お客様の事例
    感動的な顧客事例を調べて、貴社のような企業がどのように ASO World を活用して強力なモバイル アプリを作成することに成功したかを確認してください。
    how-to-pick-keywords
    App StoreとGoogle Playで成果を出すキーワードの選び方
    ストア検索を実際のインストールへつなげるキーワードを見つけ、分類し、検証するリサーチからランキングまでのフレームワーク。さらに、安全に上位表示させるための実行プランも解説します。
  • ASOナレッジカレッジ
    ブログ
    ケーススタディ
    ガイドと洞察
    一般的な問題
    用語集
    promote
    すべての季節を成長の急上昇に変える
    FIFAワールドカップから夏の需要急増、ブラックフライデーからクリスマスまで――あらゆるピークシーズンは、すでに競合が狙っているユーザー獲得のチャンスです。出遅れないでください。
    promote
    iPhone Duo ASOガイド:スクリーンショット、プレビュー、プロダクトページの最適化
    iPhone Duo向けのApp Store掲載情報の準備をしましょう:スクリーンショットのサイズ、外部ディスプレイ対内部ディスプレイのクリエイティブ、PPO/CPPテスト、ローカライゼーション、メトリクス、およびApp Reviewのルールについて。
  • 価格
ログインする 登録
logo
  • アプリプロモーションサービス
    キーワードインストール
    パッケージ名によるインストール
    評価とコメント
    良質なコメントサービス
    キーワードを保証するランキングサービス
    ASO仕える
    カスタマイズソリューション
    その他のサービス
  • ASO ツール
  • ソリューション
    By vertical
    スポーツ
    人工知能アプリケーション
    健康と運動
    eコマース
    フィンテック
    ゲーム
    教育
    デート
    エンターテイメント
    トラベル
    ソーシャルメディア
    レストランとフードテック
    生産性
    Lifestyle
    音楽
    効用
    写真とビデオ
    Casino
    Business
    ニュース
    By Performance
    季節&イベントマーケティング
    FIFA ワールドカップ 2026 アプリ成長戦略
    アプリの評判とネガティブレビュー管理
    アプリのランキングとユーザー獲得を向上
    オーガニックコンバージョンとユーザーエクスペリエンスの向上
    モバイルアプリのローンチマーケティング
    キーワードランキングとオーガニックダウンロードを増やす
  • ASOナレッジカレッジ
    ブログ
    ケーススタディ
    ガイドと洞察
    一般的な問題
    用語集
  • 価格
Important Notice
重要なお知らせ:ASOWorld の名前を騙ってパートタイムの採用や ASO 収入アプリ活動を行う詐欺にご注意ください。ASOWorld はパートタイムのスタッフを募集していません。ASOWorld が投稿した公式情報のみを信頼してください。
Close the Important Notice

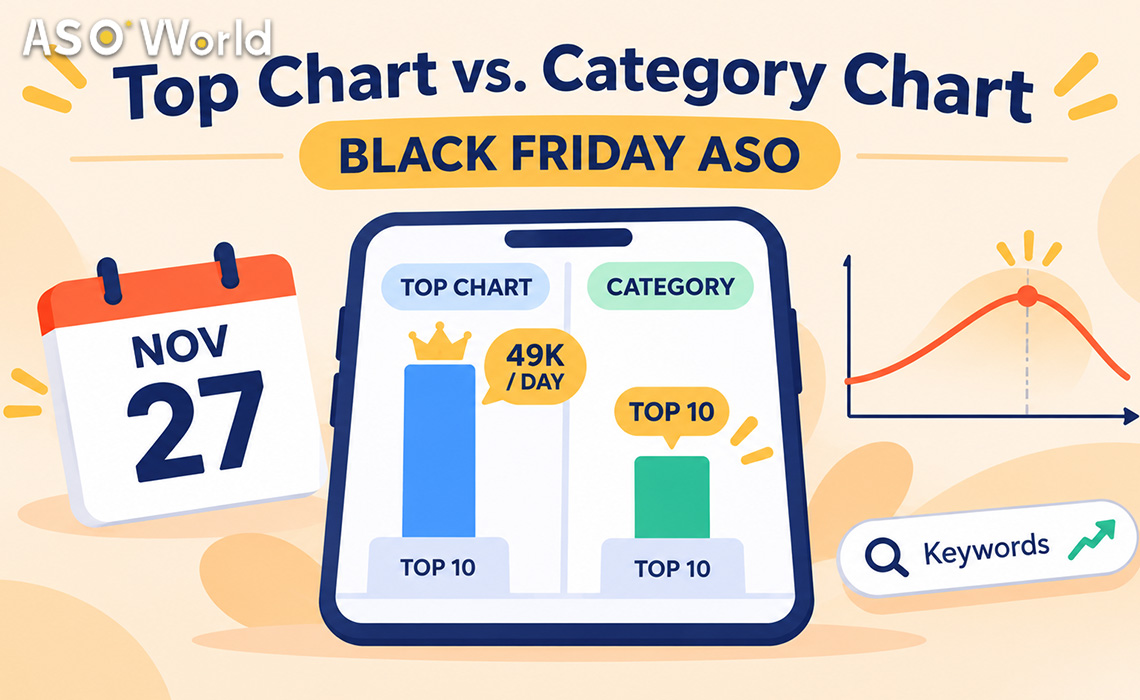
Top Chart vs. Category Chart: How Many Installs Does It Really Take Before Black Friday?

How many installs does it take to reach the top chart or a category chart? Benchmarks, a decision matrix, and a cost formula to use before Black Friday pushes.

公開日: 3 days ago
更新日: Today

ホームページ ブログ ASOガイド Top Chart vs. Category Chart: How Many Installs Does It Really Take Before Black Friday?

In twitter faceBook rss

Top Chart vs. Category Chart

TL;DR

  • Overall top charts (Top Free across all apps) are dominated by the biggest brands. Historical US iPhone data put the Top 10 at around 49,000 downloads a day for non-game apps. That is out of reach for almost every small or mid-size app.
  • Category charts are where most apps can realistically compete. The bar varies widely, from a few thousand installs a day in a mid-size European country to tens of thousands in the US, Brazil or India.
  • Chart rank depends mainly on recent install velocity, so it rises quickly and fades quickly once installs stop. Treat a chart push as a short visibility window. It doesn't last on its own.
  • During Black Friday week, Shopping and adjacent categories get much harder because retail apps raise budgets at the same time. Many apps get more for their money from a smaller storefront, a less crowded category, or keyword rankings.
  • Before you buy anything, estimate installs per day × days × unit price for the chart you're targeting. If the total is more than your monthly budget, choose a different chart or switch to keywords.


What does each chart really measure?

  Overall top chart (e.g. Top Free) Category chart (e.g. Shopping, Productivity) Keyword search ranking
Who competes Every app in the store Apps in one primary category Apps relevant to one search term
Main driver Recent install velocity at very high volume Recent install velocity within the category Relevance + installs and engagement from that search term
Who sees it Users browsing the charts Users browsing a category Users with a specific intent
How fast it moves Within days Within days Days to about two weeks, depending on the store
How fast it fades Very fast Fast Slower; positions can hold at a lower maintenance pace
Realistic for small apps? Rarely Often, in the right category and country Yes, especially on long-tail terms


Google Play charts are widely understood to factor in more than raw installs (quality and engagement signals, for example). So on Google Play, a push that brings installs without engagement tends to move the chart less, and for a shorter time.


How many installs does it take to reach the charts?

Public benchmarks are rare and get old quickly, but they give you a sense of scale.


US iPhone, overall Top Free (Sensor Tower, first half of 2019, median daily downloads)


Position Non-game apps Games
#1 ~94,000 / day ~174,000 / day
Top 10 ~49,000 / day ~43,000 / day


US iPhone, #10 in category (Sensor Tower, first half of 2019)


Category Daily downloads for #10
Photo & Video 16,000+
Shopping ~15,300
Social Networking ~14,500
Entertainment ~12,600
Productivity ~12,400


Google Play, #1 in category (AppTweak estimates, published 2022, updated 2025)


Country & category Daily downloads for #1
Spain, Travel ~4,400
Germany, Travel & Local ~8,000
US, Sports ~13,000
Brazil, Sports ~30,000
India, Sports ~87,000


Takeaways:

  1. The overall chart costs several times more than a category chart in the same country.
  2. Country matters as much as category. #1 in a mid-size European travel category can take a fraction of what US sports takes, and India's large Google Play market raises the bar sharply.
  3. Less crowded storefronts are a different game. In smaller countries and quieter categories, a few hundred extra installs a day can move category position within one to three days. That's why chart pushes there can rise faster than planned.


These are historical third-party benchmarks, not live requirements. Use them to understand scale, then check the current chart in your target country.


Which chart should you target? A decision matrix

Your situation Overall chart Category chart Keywords
Big brand or viral launch, very large budget ✅ Consider ✅ ✅
Mid-size app, clear category, moderate budget ❌ ✅ Best fit in mid-size or smaller countries ✅ Run in parallel
Small app, limited budget ❌ ⚠️ Only in a smaller country or quieter category ✅ Best fit
Shopping app in Black Friday week, US/UK ❌ ⚠️ Expensive; competitors are spending too ✅ Deal-intent long-tail terms
Non-shopping app whose category spikes in the holidays (games, photo, productivity) ❌ ✅ Time the push for peak days ✅
App with low ratings or a weak product page ❌ ❌ Fix conversion first ⚠️ Small scale only


The pattern: category charts for a short, well-timed visibility window, and keywords for steady search traffic. Most apps should run both rather than pick one.


To see how chart visibility and keyword work fit together in one acquisition plan, see the boost app rankings and user acquisition solution.


What changes during Black Friday week?

Three things raise the bar at once:

  • More competitors pushing at the same time. Retail and shopping apps increase spending in late November, so the Shopping chart threshold rises exactly when you want to be on it.
  • Charts move faster. With more installs flowing, a position held on Monday can be gone by Thursday unless your install velocity keeps up.
  • Spillover into nearby categories. Lifestyle, finance (budgeting, cashback) and photo apps often see seasonal surges too.


Practical rules for Black Friday chart pushes:

  1. Time the push for the days that matter. For Black Friday 2026 (November 27), that means roughly November 23–28. A push that peaks on November 20 will have faded by Friday.
  2. Pick your storefront deliberately. Holding a category Top 10 in a mid-size market is often worth more than sitting at #40 in the US.
  3. Keep a keyword layer underneath. Keyword rankings hold up better once the push ends.


How do you estimate the cost before you buy?

Use a simple formula:

Estimated cost = target installs per day × number of days × unit price


Then compare it with what the chart position is worth to you: extra organic installs from chart browsing, and how many of those users turn into revenue.


Illustrative example (Google Play, category chart, mid-size European country):


Input Value
Installs per day to reach and hold the category Top 10 (from your own chart check) 2,000
Push window 5 days (Nov 23–27)
Package install unit price, Google Play (base) $0.15
Estimated cost 2,000 × 5 × $0.15 = $1,500


The same push on iOS at $0.30 per install would cost about $3,000. That's why many teams push charts on Google Play in a smaller market and focus iOS spend on keywords.


Package installs are the usual tool for chart pushes. They start from $0.15 per install on Google Play and $0.30 on iOS (checked November 10, 2026), and unit prices drop as your cumulative spend reaches higher membership tiers.


A quick sanity check: if the estimated push costs more than a month of keyword work, or the chart position wouldn't bring at least a meaningful share of that cost back in organic installs, choose a smaller storefront, a quieter category, or keywords instead.


What's the alternative if chart pushes are too expensive?

Rank for what users search, not for what they browse.

  • Choose 10–20 relevant keywords, including long-tail deal or seasonal terms (gift ideas, price tracker, holiday budget). The keyword selection guide shows how to balance volume, difficulty and chance.
  • Support them with steady keyword installs over 1–2 weeks, from $0.20 on Google Play and $0.30 on iOS (checked November 10, 2026).
  • Keep the run continuous on iOS, and allow about 7–9 days for Google Play rankings to settle.

Keyword traffic also tends to convert better, because the user typed something close to what your app does.


How do you check the current threshold yourself?

You don't need a paid tool to get a rough figure:

  1. Open the category chart in your target country and note the apps at #1, #10 and #50.
  2. Look up their estimated daily installs in any app-intelligence tool, or compare with apps whose numbers you know.
  3. Watch the chart for 3–5 days at the same time each day. A stable chart means you need steady velocity; a fast-moving one means a short push can work.
  4. Check whether the apps above you are seasonal. If they are, the threshold will fall soon after the holiday.


Write the result down next to your cost estimate before you place any order.


Common chart-push mistakes

  1. Aiming for the overall chart with a category-chart budget. The gap is usually several times larger.
  2. Pushing in the US because it's the default. A smaller market where you can hold the Top 10 often pays back better.
  3. Peaking before the important days. Chart position fades within days.
  4. Ignoring conversion. A chart push sends browsing users to your page. If it doesn't convert, you pay for views that don't turn into installs.
  5. Stopping abruptly. Taper after the peak days to soften the drop, and keep keywords running underneath.


FAQ

What's the difference between the top chart and a category chart?

The overall top chart ranks every app in the store, so it's dominated by the biggest brands. A category chart ranks only apps in the same primary category, which makes it far more realistic for most apps.


How many downloads do you need to reach the top 10 on the App Store?

Historical US iPhone data (Sensor Tower, 2019) put the overall Top Free Top 10 at around 49,000 downloads a day for non-game apps. Category Top 10s needed roughly 12,000–16,000 in popular categories. Current requirements vary by country, category and season.


Is it easier to rank in a category chart in smaller countries?

Usually, yes. Fewer competing apps and lower install volumes mean a much lower threshold. Smaller storefronts can react within one to three days.


How long does a chart position last after a push?

Not long. Chart rank depends mainly on recent install velocity, so positions usually fade within days after installs drop. Plan a short window and taper afterwards.


Should a shopping app push the chart during Black Friday?

Only with a realistic budget and a clear plan for converting that traffic. Competition peaks that week, so many shopping apps get more from deal-intent keywords or a less competitive storefront.


Is it better to invest in keyword rankings or chart rankings?

For most apps, keywords give steadier, better-converting traffic, while category charts give a short visibility boost. A combination works best: keywords as the base layer, and a well-timed category push for peak days.


ASO Topic キーワード調査,ユーザー獲得,

SHARE THIS POST

In twitter faceBook

Get FREE Optimization Consultation

Let's Grow Your App & Get Massive Traffic!


All content, layout and frame code of all ASOWorld blog sections belong to the original content and technical team, all reproduction and references need to indicate the source and link in the obvious position, otherwise legal responsibility will be pursued.

ストアランキング取得能力の検出を開始します。
当社のASOツールを使用して、段階的にすべてのアプリストア最適化の取り組みを測定します。
目次

    Categories

    • アプリのマーケティング
    • アプリのプロモーション戦略
    • アプリ プロモーションのケース スタディ
    • モバイルゲームとアプリのインサイト
    • アプリストアニュース
    • ASOガイド
    • 初心者のためのASOの基本
    • アプリストアランキング
    • ユーザー獲得
    • モバイルアプリ市場の動向
    • ゲームコミュニティ
    • iOS 17 ASO ハブ
    • ASOワールドニュース
    • ASOワールドプラットフォームのガイドライン
    ASOWorld
    App Store Optimization service provider
    Follow ASOWorld:
    Boost your app via App Installs, Keyword Installs, App Reviews & Ratings & Guaranteed App Ranking.

    コメント

    まだログインしていません。まず ログイン / 登録 してください。

    関連ブログ
    App StoreやGoogle Playからアプリが削除された?その意味と公式の異議申し立てルート
    ASOガイド

    App StoreやGoogle Playからアプリが削除された?その意味と公式の異議申し立てルート

    Today
    1つのキャンペーン、3つのレバー:新規アプリのリリース後30日間におけるキーワードインストール、評価、パッケージインストールのセット運用
    ASOガイド

    1つのキャンペーン、3つのレバー:新規アプリのリリース後30日間におけるキーワードインストール、評価、パッケージインストールのセット運用

    Today
    今すぐプロモーションを開始し、アプリの探索ツアーを開始しましょう!
    大手、小規模のスタートアップを問わず、 Google Play, App Store, Galaxy Store や RuStore でアプリを低価格でプロモーションできるよう支援しています.
    今すぐプロモーションを開始し、アプリの探索ツアーを開始しましょう!
    • ASO
    • Email [email protected]
    • Contact Contact Us
    • twitter facebook linkedin instagram
    • 仕える
    • キーワードインストール
    • パッケージ名によるインストール
    • 評価とコメント
    • 良質なコメントサービス
    • キーワードを保証するランキングサービス
    • ASO仕える
    • その他のサービス
    • ASO ツール
    • 無料ASOツール
    • キーワードリサーチツール
    • キーワードの選び方
    • ASOナレッジカレッジ
    • ブログ
    • ケーススタディ
    • ガイドと洞察
    • 一般的な問題
    • 用語集
    • モバイルニュース
    • 会社
    • なぜASO World
    • 当社について
    • お問い合わせ
    • リセラープログラム
    • 始め方
    • LLM・AI 情報
    ASO World © 2020-2026 all rights reserved
    プライバシーポリシー サービス条項

    当社のウェブサイトでは Cookie を使用して、お客様の好みや繰り返しのアクセスを記憶することで、最も適切なエクスペリエンスを提供します。 「同意する」をクリックすると、すべての Cookie の使用に同意したことになります。