COVID-19 UPDATE


キーワードインストール vs 直接インストール vs CPI:ランキング、ダウンロード数、レビューに実際に影響を与えるのはどれか?


重要なお知らせ:ASOWorld の名前を騙ってパートタイムの採用や ASO 収入アプリ活動を行う詐欺にご注意ください。ASOWorld はパートタイムのスタッフを募集していません。ASOWorld が投稿した公式情報のみを信頼してください。

Copy a one-page ASO report template: 5–8 KPIs, keyword ranking tiers, spend vs. effect by tool, and next steps your boss can act on every week.


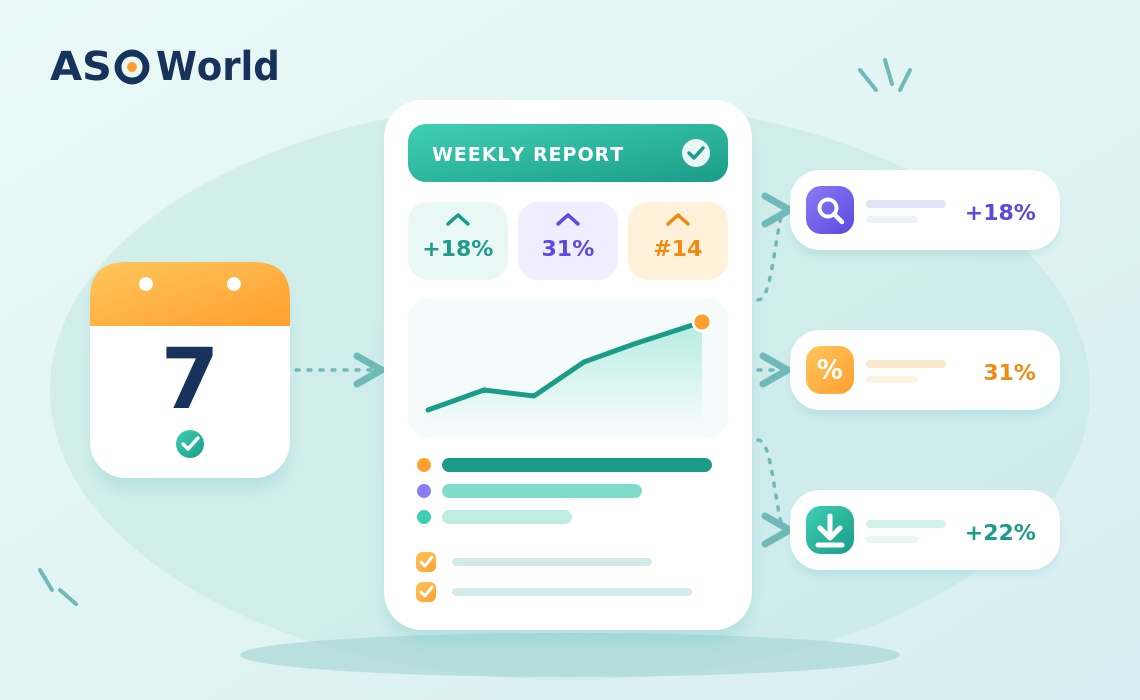
TL;DR: A good weekly ASO report fits on one page and answers five questions: Did visibility improve? Did conversion improve? Which keywords moved and why? What did we spend and what did it change? What do we do next week? Track five to eight KPIs, group keywords by ranking tier instead of listing hundreds of positions, report each growth tool against its own metric, and finish with three concrete next steps. The template below is ready to copy.
Most ASO reports fail for one of two reasons. Either they are a screenshot dump of ranking charts that no one outside the ASO team can read, or they report a single number - downloads - that hides everything that actually happened. In both cases the result is the same: the person who approves the budget can't tell whether the work is paying off.
This guide gives you a one-page weekly template, the KPIs that belong in it, a filled-in example, and the mistakes that make reports misleading.
Before choosing metrics, agree on the questions. A weekly report for a manager or client should answer:
If a metric doesn't help answer one of these, leave it out of the weekly report and keep it in your working dashboard.
Keep the core set to five to eight KPIs. More than that and nobody reads it.
| KPI | What it shows | Where to get it |
|---|---|---|
| Keyword tier distribution | How many tracked keywords sit at #1, top 5, top 10, top 50, top 250 | Your keyword tracking tool |
| Search impressions | Whether visibility in search is growing | App Store Connect / Google Play Console |
| Product page conversion rate | Share of page viewers who install | Store consoles |
| Organic installs (search + browse) | Downloads you didn't pay for directly | Store consoles |
| Category rank | Position in your main category chart | Tracking tool |
| Average rating and new ratings | Trust signal that drives conversion | Store consoles |
| Spend by tool | What was invested in keyword, install, or ad campaigns | Your own records |
| Cost per organic install (optional) | Spend divided by organic installs gained | Calculated |
Listing 200 keywords with their positions is unreadable. Grouping them tells the story in one line: “Top-10 keywords went from 12 to 17 this week; two dropped out of the top 50.” It also smooths daily noise. A common tier structure is #1, top 5, top 10, top 50, top 100, and top 250.
Pick the keywords you track carefully - a report is only as good as the list behind it. If you haven't built that list with volume, difficulty, and relevance in mind, start with our guide on how to pick the right keywords.
Copy this structure into a document or spreadsheet. Fill it in the same way every week so trends are easy to see.
| Section | What to include | Length |
|---|---|---|
| 1. Headline | One sentence: the most important change this week | 1 line |
| 2. KPI snapshot | The 5 – 8 KPIs, this week vs. last week vs. 4 weeks ago | 1 table |
| 3. Keyword tiers | Count per tier by country, with week-over-week change | 1 table |
| 4. Movers | Top 3 risers and top 3 fallers, with likely reason | 6 lines |
| 5. Activity log | What was launched, changed, or paused, with dates | Bullets |
| 6. Spend vs. effect | Spend by tool, reported against that tool's own metric | 1 table |
| 7. Risks | Rating drops, store notices, unusual volatility | Bullets |
| 8. Next week | Three actions and any decision needed | 3 lines |
Section 6 is where most reports go wrong. Different growth tools move different numbers:
| Tool | Report it against |
|---|---|
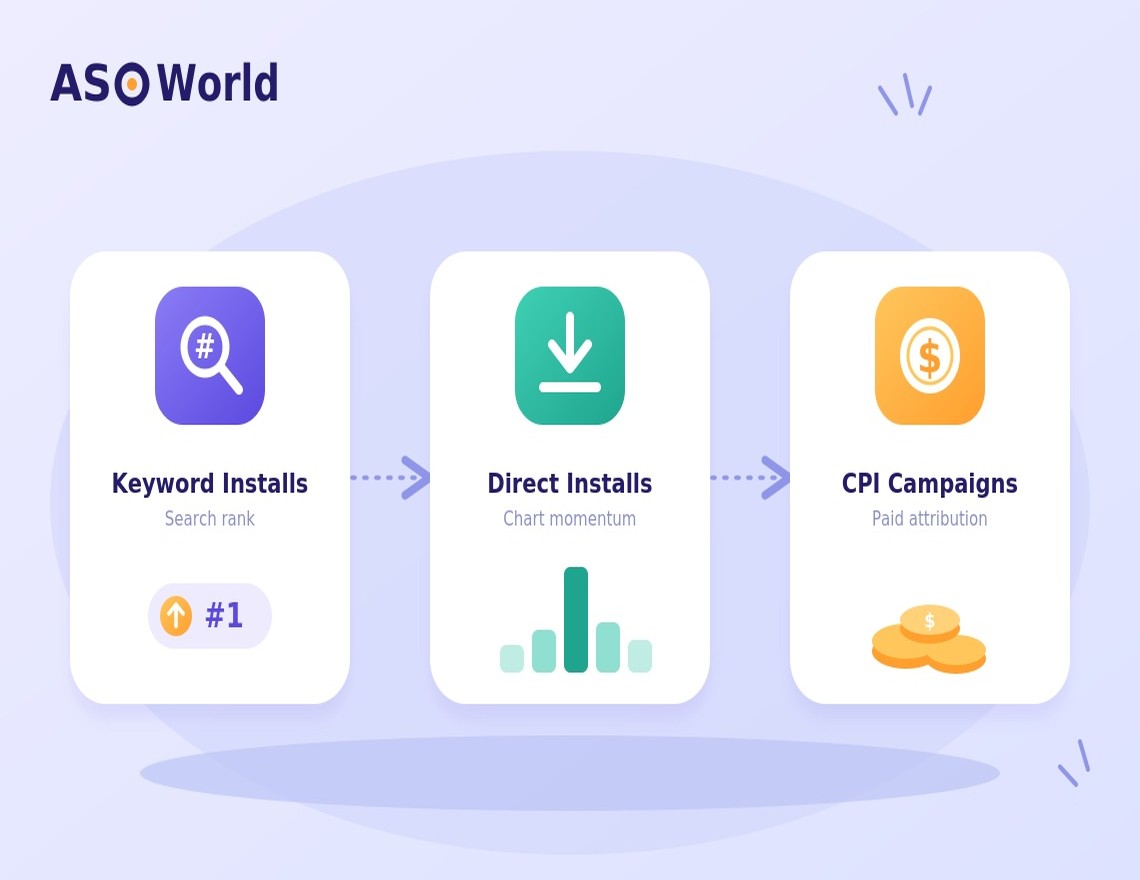
| Keyword installs | Rank on the target keywords, then search impressions and organic search installs |
| Direct installs | Category / top chart position and total downloads during the campaign |
| Paid ads (CPI) | Cost per install, retention, return on ad spend |
| Metadata or creative changes | Conversion rate at stable impression volume |
If you report a keyword campaign by total downloads, it will often look like nothing happened. If you report it by rank and the organic search installs that follow, the effect is visible.
Here is how a hypothetical productivity app's week might look. The numbers are illustrative only.
Headline: iOS US top-10 keywords rose from 9 to 14; search impressions up 18% week over week.
| KPI | This week | Last week | 4 weeks ago |
|---|---|---|---|
| Keywords in top 10 (iOS, US) | 14 | 9 | 6 |
| Search impressions (iOS, US) | 41,200 | 34,900 | 28,300 |
| Product page conversion rate | 31% | 30% | 27% |
| Organic installs (search + browse) | 2,950 | 2,410 | 1,980 |
| Category rank (Productivity, US) | 64 | 71 | 88 |
| Average rating (new ratings) | 4.6 (112) | 4.6 (97) | 4.5 (80) |
Movers: “habit tracker” 14 → 6 (keyword campaign week 2); “daily planner” 8 → 5 (new screenshots); “focus timer” 11 → 19 (competitor launched update - watch).
Spend vs. effect: keyword campaign on 4 terms; 3 reached the top 10. No direct installs this week. Paid ads paused while testing new creatives.
Risks: Google Play ranks volatile for two terms; holding at maintenance pace.
Next week: (1) Step two top-10 terms down to maintenance pace. (2) Add two long-tail terms to the campaign. (3) Decide on Black Friday chart push - budget approval needed by Friday.
| Cadence | Audience | Focus |
|---|---|---|
| Daily | ASO operator | Alerts: big rank drops, rating dips, store notices |
| Weekly | Manager, client, team | The one-page report above |
| Monthly | Department head | Trends, cost per organic install, country mix |
| Quarterly | Leadership | Strategy: markets, categories, budget for next quarter |
Don't judge decisions on daily data. iOS can move within a few days, but Google Play keyword ranks typically need about seven to nine days to settle. A weekly rhythm matches how the stores actually behave.
Bad weeks happen. A useful report explains them instead of hiding them:
The best reports end with a decision, not just a summary. A few common patterns:
What should an ASO report include?
Keyword ranking tiers, search impressions, conversion rate, organic installs, category rank, ratings, spend by tool, and three next steps. Keep it to five to eight core KPIs.
How often should I send an ASO report?
Weekly for managers and clients, monthly for trends, and quarterly for leadership strategy. Use daily data only for alerts.
How do I show the impact of keyword installs?
Report them against keyword rank first, then search impressions and organic search installs over the following weeks - not against total downloads.
What is a good conversion rate for an app store page?
It varies widely by category, country, and traffic source. Track your own trend week over week rather than chasing a universal benchmark.
Should I track every keyword?
Track a stable core list that matters to the business, grouped into ranking tiers. Monitor long-tail experiments separately.
What if my boss only cares about downloads?
Show downloads, but split them into organic and paid, and show the leading indicators - rank and impressions - that predict next month's downloads.
A report that explains cause and effect earns the next budget. Track the right list, report each tool by its own metric, and always end with what you'll do next.
Get FREE Optimization Consultation
Let's Grow Your App & Get Massive Traffic!
All content, layout and frame code of all ASOWorld blog sections belong to the original content and technical team, all reproduction and references need to indicate the source and link in the obvious position, otherwise legal responsibility will be pursued.