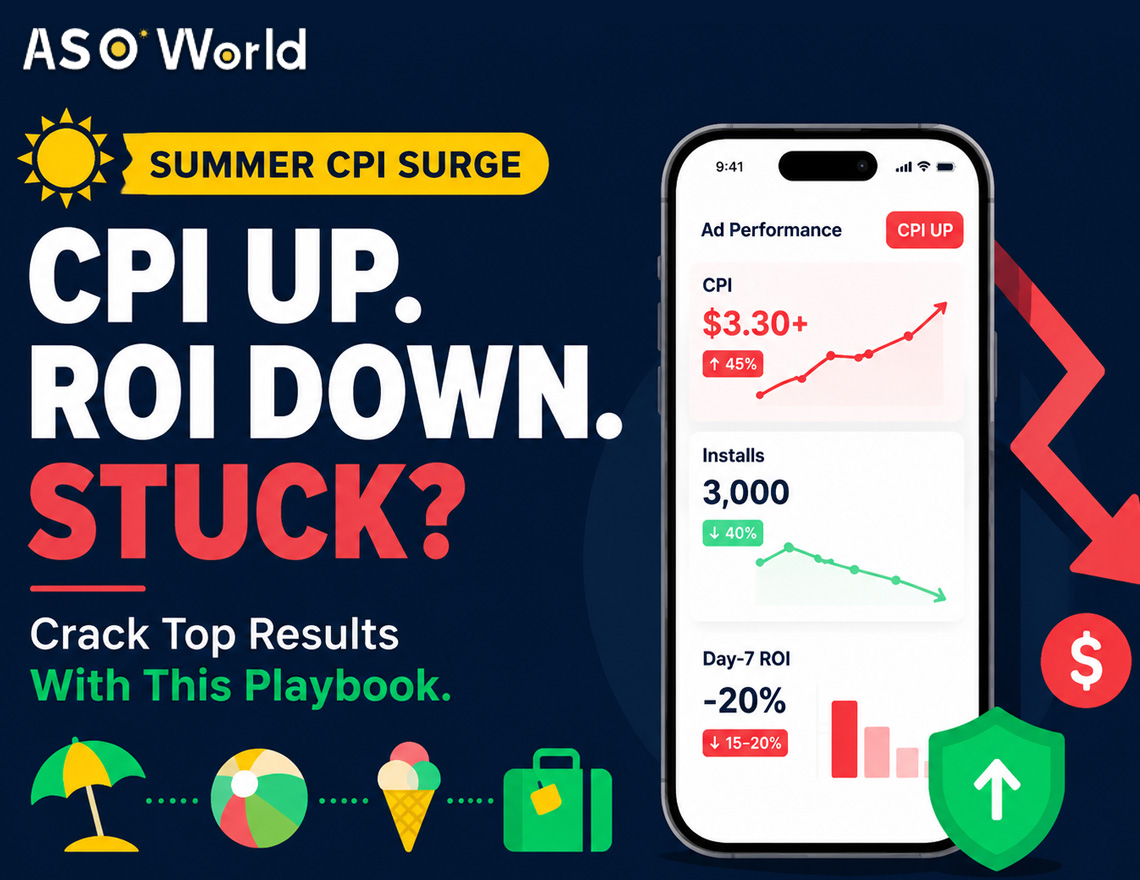
The mobile gaming industry experienced a paradigm shift in 2024, moving away from sheer download volumes towards stringent profitability and return on investment (ROI) metrics. This structural change established a new baseline for the current landscape, demanding a rigorous understanding and optimisation of Cost Per Install (CPI) to maximise capital efficiency.
What fundamental dynamics shaped mobile game CPI during this pivotal period, and how do these variables dictate user acquisition strategies today? The following objective analysis explores these core components.
The Economic Function of CPI in Mobile Games
To accurately evaluate marketing performance, it is essential to deconstruct what Cost Per Install (CPI) metrics represent financially. Statistically, CPI is the precise capital expenditure required to acquire a single verified application installation.
Rather than indiscriminately acquiring users, data-driven developers now prioritise the LTV:CPI (Lifetime Value to Cost Per Install) ratio. CPI serves as a critical budgetary threshold—forcing marketers to allocate ad spend with mathematical precision rather than speculative broadcasting.
Contemporary user acquisition (UA) managers must systematically refine their CPI targets based on game genre, target demographic, and projected ARPU (Average Revenue Per User). The strategic objective is sustainable unit economics: ensuring measurable profitability per user.
👉 Strategic Guidelines: Minimising Cost Per Install (CPI) via App Store Optimisation (ASO)
Core Variables Dictating Mobile Game CPI
The fluctuation of CPI is not random; it is heavily influenced by a matrix of interconnected market variables. The three primary determinants include:
- App category (Genre taxonomy)
- Location (Geolocation and market maturity)
- Platform (Ecosystem architecture)
App Category
The genre architecture fundamentally dictates user acquisition costs. Hyper-casual titles, characterised by frictionless gameplay mechanics, historically yield minimum CPIs due to their broad, non-specific demographic appeal.
Conversely, mid-core and hard-core genres—such as immersive RPGs or complex strategy games—demand targeted UA campaigns. Acquiring specialised player cohorts requires higher initial capital investment, justified only by stronger long-term retention and higher in-app purchase (IAP) conversion rates.
💡 Execution Strategy: Monitor seasonal market forecasting. Q4 holiday fiscal periods typically trigger severe spikes in ad auction density, predictably inflating CPI. Mitigate this by front-loading UA budgets in Q3 or employing precise retargeting parameters during peak competition intervals.
Location
Geographical economics play a decisive role. Tier 1 markets (e.g., the UK, US, and Western Europe) exhibit disproportionately high CPIs, directly correlating with superior consumer purchasing power and saturated ad inventory.
In contrast, emerging digital economies (e.g., LATAM, APAC, and specific African territories) offer high-volume UA at nominal CPIs. The operational challenge here is technological hardware fragmentation and the necessity for regionalised monetisation frameworks.
Platform
The dichotomy between iOS and Android ecosystems remains pronounced.
iOS ecosystems traditionally demand a premium CPI. This is driven by strict App Tracking Transparency (ATT) privacy frameworks and a demographic statistically predisposed to higher IAP expenditure. Despite higher baseline costs, historic data indicates iOS can yield an ROI up to 156%.
The Android OS dominates global market share, facilitating lower CPIs through sheer inventory volume. However, the resulting user base often demonstrates a lower ARPU (approx. 120% average ROI). Strategic allocation requires OS-specific bidding algorithms.
💡 Execution Strategy: Implement strict platform isolation in ad sets. Utilise SKAdNetwork (SKAN) conversion value mapping for iOS to bypass privacy blindspots, whilst leveraging broad-match algorithmic learning for Android in developing territories.
The subsequent sections detail the quantitative impact of these variables based on the 2024 economic baseline.
The Impact of Geolocation on Mobile Game CPI Dynamics
CPI mapping demonstrates severe regional variance driven by macroeconomic indicators, including GDP per capita, digital infrastructure, and cultural gaming integration.
CPI in Developed Economies
In highly developed digital economies (US, Canada, UK), CPI indexes remain at the upper echelon. Benchmark data from 2024 recorded peak US and Canadian CPIs at $3.16 and $3.30 respectively. Although parts of Western Europe registered moderate thresholds (e.g., $1.10 in select mainland nations), the aggregate cost remains high. This inflation is a direct consequence of intense corporate bidding wars targeting users with established digital subscription habits.
CPI Dynamics in Emerging Markets
Markets scaling their mobile infrastructure—such as India and Brazil—offer lucrative low-CPI environments. However, volume must not be conflated with value. To achieve sustainable ROAS (Return on Ad Spend) in these territories, developers must execute stringent application structural adjustments to accommodate lower-tier hardware processing power and localised payment gateways.
👉 Comparative Analysis: Western vs Eastern In-App Purchasing Behaviour
💡 Execution Strategy: To mathematically reduce CPI in foreign territories, deep app localisation strategies are mandatory. Syntax translation is insufficient; developers must integrate regional cultural signifiers and UI/UX preferences. This methodology demonstrably increases organic conversion rates (CVR), thereby lowering blended CPI.
For systemic execution, ASOWorld provides bespoke ASO parameters engineered for global metadata compliance. Optimised storefront algorithms ensure logical capital deployment across diverse geolocations.
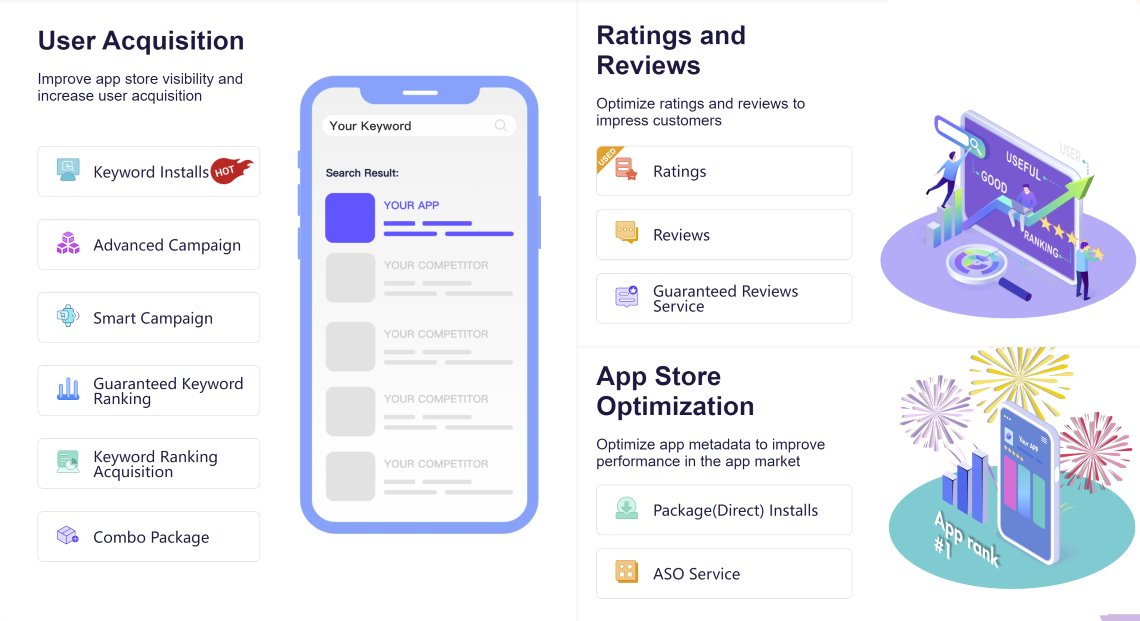
* Optimise algorithmic indexing—utilise our deterministic keyword indexing solutions to secure top-tier positioning. Alternatively, interact with the schematic above to review our sustainable app volume scaling protocols.
* Technical Breakdown: Guaranteed Keyword Ranking Mechanics & ROI Viability
Category-Specific CPI Forecasting Models
A static UA methodology is categorically invalid. CPI metrics must be indexed against the exact mechanics of the application software.
Hypercasual and Puzzle Games
Hypercasual portfolios rely on arbitrage. By maintaining exceptionally low CPI limits, these applications rely heavily on aggressive ad-based monetisation structures. The statistical friction point is Day-7 (D7) retention, prompting developers to focus capital on rapid user turnover and cross-promotion.
Simulation and RPG Games
Complex digital environments (RPGs, 4X Strategy) demand upfront capital risk. The high CPI inherent to these categories must be mitigated by mapping deep-funnel events—bidding on users analytically proven to execute in-app transactions at Day-30 (D30) or beyond.
👉 Specialised Gaming User Acquisition Solutions

Access the "ASO World" dashboard to calibrate your UA framework using our promotional infrastructure.
Multiplayer and Battle Royale Games
CPI in the competitive synchronous space is heavily distorted by network effects. A critical mass of Concurrent Users (CCU) is required simply to maintain matchmaking viability, forcing studios to absorb higher initial CPIs to prevent immediate ecosystem collapse.
Sports and Racing Games
In licensed physics-based simulators, graphical fidelity natively inflates conversion expectations. Studios must factor IP licensing overheads into their target CPI ratios to calculate an accurate break-even point.
💡 Execution Strategy: Macro-environmental awareness dictates micro-bidding efficiency. Review diagnostic reports such as the "Comprehensive 2024 Global Mobile Gaming Market Analysis" to align your product life-cycle with empirical industry trends.
Ecosystem Optimisation: Platform Governance
The structural divergence between Apple’s iOS and Google's Android architectures mathematically alters CPI trajectories.
iOS vs. Android Algorithmic Divergence
Apple’s deprecated IDFA (Identifier for Advertisers) fundamentally degraded deterministic targeting, temporarily injecting volatility into iOS CPIs. Conversely, Android relies on probabilistic modelling across a deeply fragmented device ecosystem. The primary objective is mapping precise post-install conversion schemas to offset generic data inputs.
👉 Algorithmic Discrepancies: iOS App Store vs. Google Play Store

Data-Driven Budget Allocation
Historical telemetry from Q4 2023 and early 2024 highlighted a 3% YoY increase in iOS marketing expenditure, running parallel to an aggregated 8% CPI contraction towards the fiscal year threshold. This indicates the necessity for fluid budget routing—funnelling capital dynamically to platforms presenting the lowest cost-per-action (CPA) on a rolling 7-day basis.
Focusing on Mobile Game CPI Trajectories
The contemporary performance marketing sector operates on a framework where CPI acts as a diagnostic tool, not an isolated KPI. Raw install volume holds negligible value without correlative engagement velocity and monetisation depth. Rational capital deployment demands that marketers continually cross-reference CPI with LTV projections and platform algorithms, ensuring every fiscal cycle is anchored in scientific measurement and mathematical profitability.
 COVID-19 UPDATE