noticeCOVID-19 UPDATE ASO World entire team is working remotely. we expect no disruptions in our ASO services.
Browser close
50% OFF FIRST ORDER
Referral Program
bonusprogram
50% OFF FIRST ORDER
Referral Program
bonusprogram
logo
  • 앱 프로모션 서비스
    키워드 설치
    패키지명(직접) 설치
    평점 및 리뷰
    고품질 리뷰 서비스
    키워드 랭킹 서비스 보증
    ASO 제공하다
    맞춤형 솔루션
    더 많은 서비스
  • ASO 도구
    무료 ASO 도구
    키워드 리서치 도구
    키워드 선택 방법
    promote
    모든 시즌을 성장 급증으로 바꾸세요
    FIFA 월드컵부터 여름 성수기, 블랙프라이데이부터 크리스마스까지 — 모든 성수기는 이미 경쟁사들이 공략하고 있는 사용자 확보의 기회입니다. 늦지 마세요.
  • 솔루션
    By vertical
    스포츠
    HOT
    일체 포함
    건강 및 피트니스
    전자상거래
    핀테크
    HOT
    게임
    교육
    데이트
    엔터테인먼트
    여행하다
    소셜 미디어
    레스토랑 및 푸드테크
    생산력
    Lifestyle
    음악
    Utility
    사진 & 비디오
    Casino
    Business
    소식
    NEW
    By Performance
    시즌 및 이벤트 마케팅
    NEW
    FIFA 월드컵 2026 앱 성장 전략
    HOT
    앱 평판 및 부정적 리뷰 관리
    앱 순위 및 사용자 확보 향상
    NEW
    유기적 반응 및 사용자 경험 개선
    NEW
    모바일 앱 출시 마케팅
    NEW
    키워드 순위 및 유기적 다운로드 증가
    NEW
    solution-suffix
    고객 스토리
    영감을 주는 고객 사례를 살펴보고 귀하와 같은 기업이 ASO World를 성공적으로 활용하여 강력한 모바일 앱을 만든 방법을 알아보세요.
    how-to-pick-keywords
    앱스토어와 구글플레이를 위한 올바른 키워드 선택 방법
    스토어 검색을 실제 설치로 전환하는 키워드를 찾고, 분류하고, 검증하는 리서치-투-랭킹 프레임워크와 안전하게 순위를 올리는 실행 플랜을 소개합니다.
  • ASO 아카데미
    블로그
    사례 연구
    가이드 및 통찰력
    일반적인 문제
    용어 사전
    promote
    모든 시즌을 성장 급증으로 바꾸세요
    FIFA 월드컵부터 여름 성수기, 블랙프라이데이부터 크리스마스까지 — 모든 성수기는 이미 경쟁사들이 공략하고 있는 사용자 확보의 기회입니다. 늦지 마세요.
    promote
    iPhone 듀오 ASO 가이드: 스크린샷, 미리보기 및 제품 페이지 최적화
    iPhone Duo를 위한 App Store 등록정보를 준비하세요: 스크린샷 크기, 외부 vs 내부 디스플레이 크리에이티브, PPO/CPP 테스트, 현지화, 지표 및 앱 심사 규정.
  • 가격
로그인 가입
logo
  • 앱 프로모션 서비스
    키워드 설치
    패키지명(직접) 설치
    평점 및 리뷰
    고품질 리뷰 서비스
    키워드 랭킹 서비스 보증
    ASO 제공하다
    맞춤형 솔루션
    더 많은 서비스
  • ASO 도구
  • 솔루션
    By vertical
    스포츠
    일체 포함
    건강 및 피트니스
    전자상거래
    핀테크
    게임
    교육
    데이트
    엔터테인먼트
    여행하다
    소셜 미디어
    레스토랑 및 푸드테크
    생산력
    Lifestyle
    음악
    Utility
    사진 & 비디오
    Casino
    Business
    소식
    By Performance
    시즌 및 이벤트 마케팅
    FIFA 월드컵 2026 앱 성장 전략
    앱 평판 및 부정적 리뷰 관리
    앱 순위 및 사용자 확보 향상
    유기적 반응 및 사용자 경험 개선
    모바일 앱 출시 마케팅
    키워드 순위 및 유기적 다운로드 증가
  • ASO 아카데미
    블로그
    사례 연구
    가이드 및 통찰력
    일반적인 문제
    용어 사전
  • 가격
Important Notice
중요 공지:파트타임 채용이나 ASO 수익 앱 활동을 위해 ASOWorld의 이름을 사용하는 사기에 주의하세요. ASOWorld는 파트타임 직원을 채용하지 않습니다. ASOWorld가 게시한 공식 정보만 신뢰하세요.
Close the Important Notice

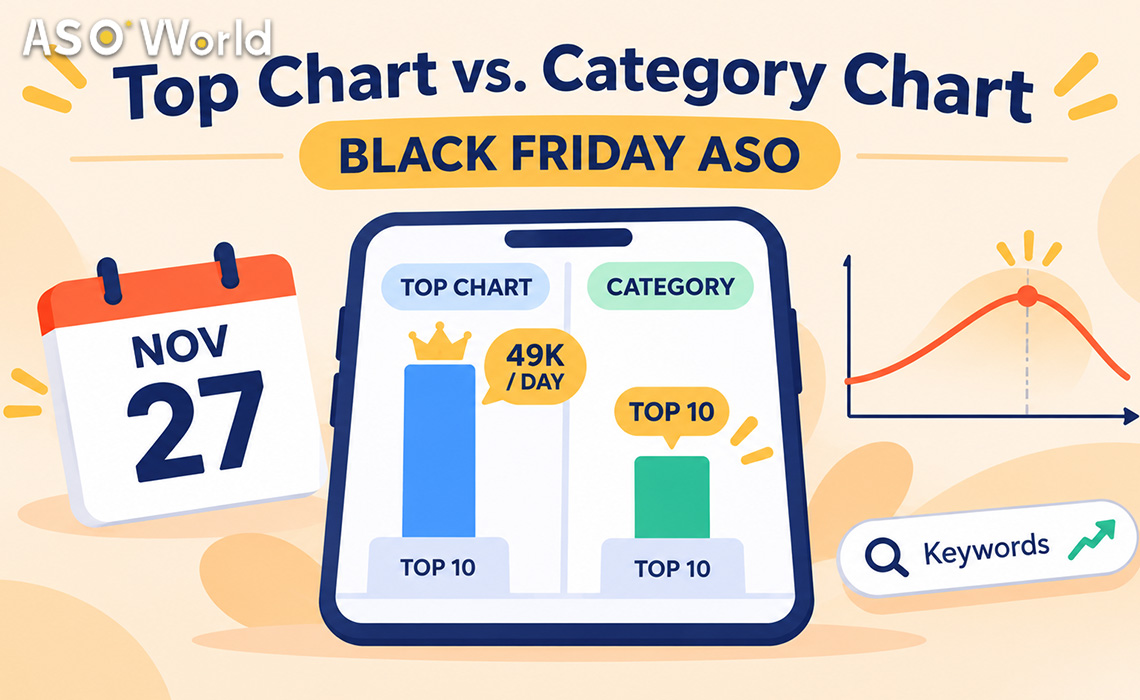
Top Chart vs. Category Chart: How Many Installs Does It Really Take Before Black Friday?

How many installs does it take to reach the top chart or a category chart? Benchmarks, a decision matrix, and a cost formula to use before Black Friday pushes.

공개 날짜: 3 days ago
업데이트 날짜: Today

홈페이지 블로그 ASO 가이드 Top Chart vs. Category Chart: How Many Installs Does It Really Take Before Black Friday?

In twitter faceBook rss

Top Chart vs. Category Chart

TL;DR

  • Overall top charts (Top Free across all apps) are dominated by the biggest brands. Historical US iPhone data put the Top 10 at around 49,000 downloads a day for non-game apps. That is out of reach for almost every small or mid-size app.
  • Category charts are where most apps can realistically compete. The bar varies widely, from a few thousand installs a day in a mid-size European country to tens of thousands in the US, Brazil or India.
  • Chart rank depends mainly on recent install velocity, so it rises quickly and fades quickly once installs stop. Treat a chart push as a short visibility window. It doesn't last on its own.
  • During Black Friday week, Shopping and adjacent categories get much harder because retail apps raise budgets at the same time. Many apps get more for their money from a smaller storefront, a less crowded category, or keyword rankings.
  • Before you buy anything, estimate installs per day × days × unit price for the chart you're targeting. If the total is more than your monthly budget, choose a different chart or switch to keywords.


What does each chart really measure?

  Overall top chart (e.g. Top Free) Category chart (e.g. Shopping, Productivity) Keyword search ranking
Who competes Every app in the store Apps in one primary category Apps relevant to one search term
Main driver Recent install velocity at very high volume Recent install velocity within the category Relevance + installs and engagement from that search term
Who sees it Users browsing the charts Users browsing a category Users with a specific intent
How fast it moves Within days Within days Days to about two weeks, depending on the store
How fast it fades Very fast Fast Slower; positions can hold at a lower maintenance pace
Realistic for small apps? Rarely Often, in the right category and country Yes, especially on long-tail terms


Google Play charts are widely understood to factor in more than raw installs (quality and engagement signals, for example). So on Google Play, a push that brings installs without engagement tends to move the chart less, and for a shorter time.


How many installs does it take to reach the charts?

Public benchmarks are rare and get old quickly, but they give you a sense of scale.


US iPhone, overall Top Free (Sensor Tower, first half of 2019, median daily downloads)


Position Non-game apps Games
#1 ~94,000 / day ~174,000 / day
Top 10 ~49,000 / day ~43,000 / day


US iPhone, #10 in category (Sensor Tower, first half of 2019)


Category Daily downloads for #10
Photo & Video 16,000+
Shopping ~15,300
Social Networking ~14,500
Entertainment ~12,600
Productivity ~12,400


Google Play, #1 in category (AppTweak estimates, published 2022, updated 2025)


Country & category Daily downloads for #1
Spain, Travel ~4,400
Germany, Travel & Local ~8,000
US, Sports ~13,000
Brazil, Sports ~30,000
India, Sports ~87,000


Takeaways:

  1. The overall chart costs several times more than a category chart in the same country.
  2. Country matters as much as category. #1 in a mid-size European travel category can take a fraction of what US sports takes, and India's large Google Play market raises the bar sharply.
  3. Less crowded storefronts are a different game. In smaller countries and quieter categories, a few hundred extra installs a day can move category position within one to three days. That's why chart pushes there can rise faster than planned.


These are historical third-party benchmarks, not live requirements. Use them to understand scale, then check the current chart in your target country.


Which chart should you target? A decision matrix

Your situation Overall chart Category chart Keywords
Big brand or viral launch, very large budget ✅ Consider ✅ ✅
Mid-size app, clear category, moderate budget ❌ ✅ Best fit in mid-size or smaller countries ✅ Run in parallel
Small app, limited budget ❌ ⚠️ Only in a smaller country or quieter category ✅ Best fit
Shopping app in Black Friday week, US/UK ❌ ⚠️ Expensive; competitors are spending too ✅ Deal-intent long-tail terms
Non-shopping app whose category spikes in the holidays (games, photo, productivity) ❌ ✅ Time the push for peak days ✅
App with low ratings or a weak product page ❌ ❌ Fix conversion first ⚠️ Small scale only


The pattern: category charts for a short, well-timed visibility window, and keywords for steady search traffic. Most apps should run both rather than pick one.


To see how chart visibility and keyword work fit together in one acquisition plan, see the boost app rankings and user acquisition solution.


What changes during Black Friday week?

Three things raise the bar at once:

  • More competitors pushing at the same time. Retail and shopping apps increase spending in late November, so the Shopping chart threshold rises exactly when you want to be on it.
  • Charts move faster. With more installs flowing, a position held on Monday can be gone by Thursday unless your install velocity keeps up.
  • Spillover into nearby categories. Lifestyle, finance (budgeting, cashback) and photo apps often see seasonal surges too.


Practical rules for Black Friday chart pushes:

  1. Time the push for the days that matter. For Black Friday 2026 (November 27), that means roughly November 23–28. A push that peaks on November 20 will have faded by Friday.
  2. Pick your storefront deliberately. Holding a category Top 10 in a mid-size market is often worth more than sitting at #40 in the US.
  3. Keep a keyword layer underneath. Keyword rankings hold up better once the push ends.


How do you estimate the cost before you buy?

Use a simple formula:

Estimated cost = target installs per day × number of days × unit price


Then compare it with what the chart position is worth to you: extra organic installs from chart browsing, and how many of those users turn into revenue.


Illustrative example (Google Play, category chart, mid-size European country):


Input Value
Installs per day to reach and hold the category Top 10 (from your own chart check) 2,000
Push window 5 days (Nov 23–27)
Package install unit price, Google Play (base) $0.15
Estimated cost 2,000 × 5 × $0.15 = $1,500


The same push on iOS at $0.30 per install would cost about $3,000. That's why many teams push charts on Google Play in a smaller market and focus iOS spend on keywords.


Package installs are the usual tool for chart pushes. They start from $0.15 per install on Google Play and $0.30 on iOS (checked November 10, 2026), and unit prices drop as your cumulative spend reaches higher membership tiers.


A quick sanity check: if the estimated push costs more than a month of keyword work, or the chart position wouldn't bring at least a meaningful share of that cost back in organic installs, choose a smaller storefront, a quieter category, or keywords instead.


What's the alternative if chart pushes are too expensive?

Rank for what users search, not for what they browse.

  • Choose 10–20 relevant keywords, including long-tail deal or seasonal terms (gift ideas, price tracker, holiday budget). The keyword selection guide shows how to balance volume, difficulty and chance.
  • Support them with steady keyword installs over 1–2 weeks, from $0.20 on Google Play and $0.30 on iOS (checked November 10, 2026).
  • Keep the run continuous on iOS, and allow about 7–9 days for Google Play rankings to settle.

Keyword traffic also tends to convert better, because the user typed something close to what your app does.


How do you check the current threshold yourself?

You don't need a paid tool to get a rough figure:

  1. Open the category chart in your target country and note the apps at #1, #10 and #50.
  2. Look up their estimated daily installs in any app-intelligence tool, or compare with apps whose numbers you know.
  3. Watch the chart for 3–5 days at the same time each day. A stable chart means you need steady velocity; a fast-moving one means a short push can work.
  4. Check whether the apps above you are seasonal. If they are, the threshold will fall soon after the holiday.


Write the result down next to your cost estimate before you place any order.


Common chart-push mistakes

  1. Aiming for the overall chart with a category-chart budget. The gap is usually several times larger.
  2. Pushing in the US because it's the default. A smaller market where you can hold the Top 10 often pays back better.
  3. Peaking before the important days. Chart position fades within days.
  4. Ignoring conversion. A chart push sends browsing users to your page. If it doesn't convert, you pay for views that don't turn into installs.
  5. Stopping abruptly. Taper after the peak days to soften the drop, and keep keywords running underneath.


FAQ

What's the difference between the top chart and a category chart?

The overall top chart ranks every app in the store, so it's dominated by the biggest brands. A category chart ranks only apps in the same primary category, which makes it far more realistic for most apps.


How many downloads do you need to reach the top 10 on the App Store?

Historical US iPhone data (Sensor Tower, 2019) put the overall Top Free Top 10 at around 49,000 downloads a day for non-game apps. Category Top 10s needed roughly 12,000–16,000 in popular categories. Current requirements vary by country, category and season.


Is it easier to rank in a category chart in smaller countries?

Usually, yes. Fewer competing apps and lower install volumes mean a much lower threshold. Smaller storefronts can react within one to three days.


How long does a chart position last after a push?

Not long. Chart rank depends mainly on recent install velocity, so positions usually fade within days after installs drop. Plan a short window and taper afterwards.


Should a shopping app push the chart during Black Friday?

Only with a realistic budget and a clear plan for converting that traffic. Competition peaks that week, so many shopping apps get more from deal-intent keywords or a less competitive storefront.


Is it better to invest in keyword rankings or chart rankings?

For most apps, keywords give steadier, better-converting traffic, while category charts give a short visibility boost. A combination works best: keywords as the base layer, and a well-timed category push for peak days.


ASO Topic 키워드 연구,사용자 획득,

SHARE THIS POST

In twitter faceBook

Get FREE Optimization Consultation

Let's Grow Your App & Get Massive Traffic!


All content, layout and frame code of all ASOWorld blog sections belong to the original content and technical team, all reproduction and references need to indicate the source and link in the obvious position, otherwise legal responsibility will be pursued.

스토어 랭킹 취득 능력 검출 시작
ASO 도구로 한 단계씩 모든 앱 스토어 최적화 작업 측정
목차

    Categories

    • 앱 마케팅
    • 앱 프로모션 전략
    • 앱 프로모션 사례 연구
    • 모바일 게임 및 앱 인사이트
    • 앱 스토어 뉴스
    • ASO 가이드
    • 초보자를 위한 ASO 기초
    • 앱 스토어 순위
    • 사용자 획득
    • 모바일 앱 시장 동향
    • 게임 커뮤니티
    • iOS 17 ASO 허브
    • 아소월드 뉴스
    • ASO World Platform 가이드라인
    ASOWorld
    App Store Optimization service provider
    Follow ASOWorld:
    Boost your app via App Installs, Keyword Installs, App Reviews & Ratings & Guaranteed App Ranking.

    댓글

    아직 로그인하지 않았습니다. 먼저 로그인 / 회원가입 해주세요.

    관련 블로그
    앱이 앱스토어 또는 구글 플레이에서 삭제되었나요? 그 의미와 공식 이의 신청 경로
    ASO 가이드

    앱이 앱스토어 또는 구글 플레이에서 삭제되었나요? 그 의미와 공식 이의 신청 경로

    Today
    하나의 캠페인, 세 개의 레버: 신규 앱 출시 초기 30일을 위한 키워드 설치, 평점 및 패키지 설치 결합 전략
    ASO 가이드

    하나의 캠페인, 세 개의 레버: 신규 앱 출시 초기 30일을 위한 키워드 설치, 평점 및 패키지 설치 결합 전략

    Today
    프로모션 지금 바로 시작, 당신의 앱 탐색 여행을 시작하세요!
    고객님이 대기업이든 소규모 신생기업이든 Google Play, App Store, Galaxy Store 와 RuStore 에서 더 저렴한 가격으로 고객님의 앱을 홍보할 수 있도록 도와드립니다.
    프로모션 지금 바로 시작, 당신의 앱 탐색 여행을 시작하세요!
    • ASO
    • Email [email protected]
    • Contact Contact Us
    • twitter facebook linkedin instagram
    • 제공하다
    • 키워드 설치
    • 패키지명(직접) 설치
    • 평점 및 리뷰
    • 고품질 리뷰 서비스
    • 키워드 랭킹 서비스 보증
    • ASO 제공하다
    • 더 많은 서비스
    • ASO 도구
    • 무료 ASO 도구
    • 키워드 리서치 도구
    • 키워드 선택 방법
    • ASO 아카데미
    • 블로그
    • 사례 연구
    • 가이드 및 통찰력
    • 일반적인 문제
    • 용어 사전
    • 마케팅 뉴스
    • 회사
    • ASO World를 선택하는 이유
    • 우리에 관해
    • 문의하기
    • 리셀러 프로그램
    • 시작하기
    • LLM & AI 정보
    ASO World © 2020-2026 all rights reserved
    개인정보 처리 방침 서비스 약관

    당사는 웹사이트에서 쿠키를 사용하여 귀하의 기본 설정과 반복 방문을 기억하여 가장 관련성 높은 경험을 제공합니다. "수락"을 클릭하면 모든 쿠키 사용에 동의하는 것입니다.