In early October, Apple released an update to App Store Connect that finally showcased the new metrics Apple discussed at WWDC 2021 in June.
Announced in an update to Apple's developer site, the new analytics metrics available through App Store Connect are designed to provide a more granular view of an app's overall performance and allow developers to make changes accordingly.
Apple said the new tools include redownloads, total downloads, proceeds, pre-orders and updates, all of which can be displayed by region, source type, device and more. The company added that access to the new data will help developers understand the factors that drive growth and success.
These metrics bring a major shift in the way you perceive, measure and understand App Store installations. Developers now have access to a host of new App Store metrics to keep a close eye on app performance, measure customer interest and more.
App Store metrics update
New mobile app and game "Downloads" metrics
Until now, Apple has provided two metrics to see how many people have installed apps.
The old metrics
App Units - This is the first app installation (more accurately, people who click the Get button, whether they complete the installation or not) and does not include any users who reinstalled the app after previously uninstalling it. This metric is measured against a unique Apple ID.
Installed - This is the number of users who installed the app on their device (successfully completed the installation process). The total number of installs is only those who chose to share data with the app developer when they first set up their iPhone.
These metrics mean that you, whether you are a mobile marketer, ASO person, or UA person, cannot determine how many people have actually installed your app because redownloads are not visible to you.
New Metrics
With the new metrics, Apple is sharing with you for the first time, the total number of downloads, which includes both re-downloads and first-time downloads (which you can filter accordingly). This will provide the ability to distinguish new users from returning users.
This will be the only source in the world to verify the number of downloads and re-downloads - which is the most accurate.
Developers can use these new metrics to analyze new user acquisition, as well as re-engagement of lost users and retention of existing users. "Updates" will show developers the total number of updates to the app, including automatic updates. This can provide insight into how existing users are interacting with the app by keeping it up to date.
Comparing "Updates" to "Redownloads" - showing the total number of app redownloads without automatic updates or device recovery - provides a more detailed view of how existing or lapsed users are reusing the app. The ability to filter these metrics by device type, geography, and source type will help developers understand how best to optimize their App Store optimization strategies for their target demographic.

Click "Learn More" to drive your apps & games business with ASO World app promotion service now.
App Analytics Metrics - Pre-orders
Developers now have access to a dedicated pre-order dashboard that shows the total number of pre-orders placed minus cancellations. This will help provide insight into the factors that will drive monetization the most before the app is launched. The data collected here can be used to improve the profitability of the application.
Pre-orders can also be filtered by familiar metrics such as territory and device type, which now includes macOS for compatible apps. app Store and usage data is only available for handheld devices running iOS 8 and later and Mac devices running macOS 10.15.1 or later.
On the Metrics tab, pre-orders can be viewed on a line graph over time. This allows developers and mobile marketers to understand user engagement from the start of a booking to the day before launch.
App Analytics Metrics - Proceeds
Proceeds is another new monetization metric that developers can now view through App Analytics. This is available along with the existing Sales and In-App Purchases metrics.
From Apple's App Store Connect help page, proceeds is defined as.
"The estimated amount of proceeds you will receive from your sales. This is the Customer Price minus applicable taxes and Apple's commission, per Schedule 2 of the Paid Applications Agreement."
A deeper understanding of how apps are monetized can give developers a more complete picture of how to effectively optimize their apps to increase purchase rates. This metric should be helpful when planning and deploying paid campaigns to acquire users, as a more granular view of their return on investment is now available.
Why are app metrics analytics important?
Mobile app metrics are critical, because without them companies can't tell if their apps are succeeding or failing. Not only these metrics are related to your app ranking deeply, but also can mask the fact that apps can lose money or users faster than they can attract them. By applying metrics, companies can see these problems and take action.
We can take a look at the developer console from Apple Store Connect and have a basic idea of what metrics we should pay attention to.
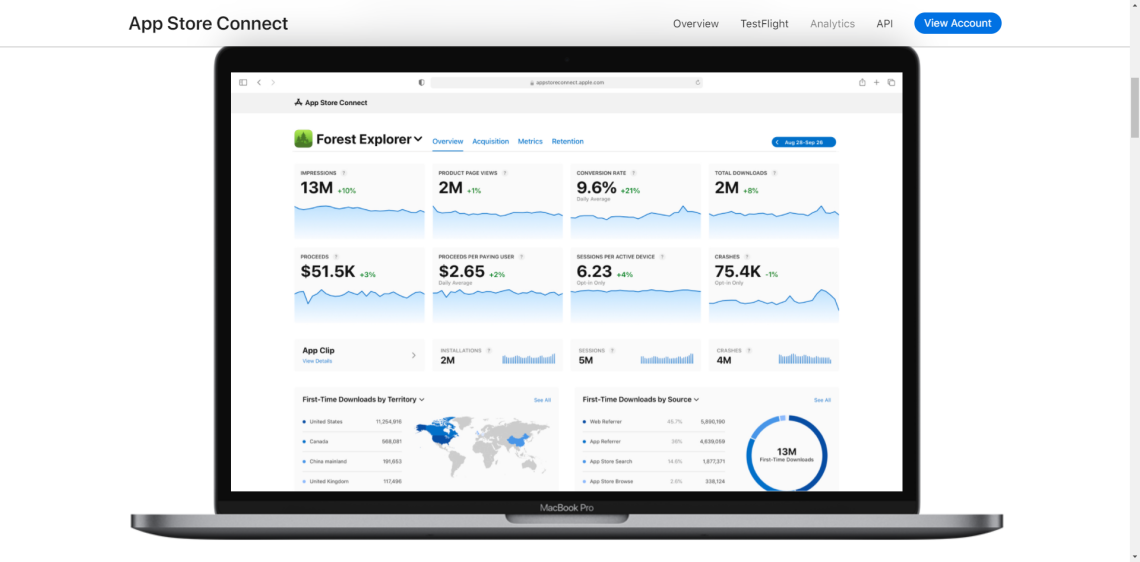
Source: Apple
Understanding Traffic Sources
When reporting performance, Apple breaks down reporting by channel. This includes:
App Store Search - "The first time a customer views or clicks to download your app from the App Store search. Include search ads in App Store Search."
App Store Browse - "The first time a customer viewed or clicked to download your app while browsing certain parts of the App Store, including popular charts and categories."
App Referrer - "Customers click on a link in the app that takes them to your App Store product page. This includes apps that use the StoreKit API to load your product pages."
Web Referrer - "Customers click on a link on a website that takes them to your App Store product page."
Unavailable - "Source type is not available because the customer downloaded your app before App Analytics tracked source attribution."
Search metrics show organic searches and Apple Search Ads, while App Store Browse shows metrics for users discovering the app outside of search. App and Web Referrer include traffic from other apps and external websites, respectively.
In addition to filtering data by channel, it's important to filter by geography. In this way, you can narrow down how changes in a particular localization affect that region without having to group other regions together.
Tracking performance
When tracking performance on the App Store, App Store Connect reports on a number of key metrics to monitor.
Impressions - "The number of times your app is viewed in the App Store for more than one second. This includes search results, Featured, Views, Top Charts, and App Product Page Views."
Product Page Views - The number of times your app page is clicked and viewed.
First-time downloads - The total number of first-time downloads of your app.
Re-downloads - The total number of re-downloads of your app. Does not include auto-updates or device restores.
App Store Connect provides additional metrics, such as sales, crashes, etc., that you should monitor based on the changes you make - however, when tracking your visibility and conversions, the "Impressions" and downloads metrics are the most important. Display counts are a better way to measure discoverability in search, as most users will download directly from search without having to click through to see your product pages. Also, remember that these metrics are relevant to users who have never installed your app before.
Measuring Impact
When you want to measure the success of natural results, whether it's display counts or app units, you should understand the type of impact you're measuring. New metadata, screenshots, changes in paid marketing, etc. can have a different impact on performance.
Here're some top marketing metrics you need to pay attention:
1. App Store Conversion Rate (CVR)
This is the percentage of users who download your app to the total number of users who visit your app store page. the CVR varies by app category, app platform (iOS or Android), and country/region.
The average CVR in the U.S. is 32.53% in the Apple App Store and 29.7% in the Google Play Store - but this varies by category. For example, in the App Store, the average conversion rate for the Weather category was a high 87.3%, while the average conversion rate for Food & Beverage was 5.8%.
2. CTR (Click-Through Rate)
CTR measures the number of clicks your ad receives divided by the number of times the ad is displayed or the number of times the ad is viewed. It measures how often an ad prompts viewers to "click" on the specific location to which the ad is directed.
CTR is a reflection of user interest and engagement, so the higher the CTR value, the better. A high click-through rate correlates with the quality and relevance of the ad and affects the price you pay for each ad served. 3.
3. CPI (Cost Per Install)
CPI tells you the cost of acquiring new users from a paid ad. It is calculated by dividing the ad spend in a given time period by the crazy number of new installs in the same period.
The CPI benchmark varies by app type, industry, country and ad platform.
4. CPC (Cost Per Click)
This metric tells you how much you need to pay for each pay-per-click help. It varies by ad platform, device, and even ad location. the CPC for Instagram ads will be different from ads placed on desktop feeds, ads placed on mobile feeds, etc.
5. ROAS (Return on Ad Spend)
ROAS measures the revenue you get for every dollar you spend on an ad - so basically the profit you make from a specific ad campaign, whether it's Apple Search Ads, Facebook, etc.
It's important to track changes in your application's performance after updates to measure impact. For example, if you are updating metadata to improve keyword visibility and ranking, track the impact on the number of times you are displayed in search. If you change screenshots or other creative elements, monitor their impact on conversion rates.
Understanding the source filters and metric definitions in App Store Connect is critical to understanding your performance. To better understand the effectiveness of your App Store optimization, it's also important to measure your keyword rankings as you make changes.
Monitoring which high-traffic keywords your app is ranking for and which are not working can help you gain insight into how users are discovering your app organically. For example, if you notice an increase in search display after a metadata deployment, measuring which high search volume keywords your app has moved to the top of the rankings can give you insight into how users are discovering your app, something App Store Connection can't do.
Prepare for new App Store metrics
Measuring impact is key to ASO success. Fortunately, Apple offers a platform that provides a useful approach to help understand performance.
When analyzing the impact of deployment or campaign, you need to make sure you understand what is being optimized, such as metadata or creative. Whether it's metadata, creative or something completely different, understanding what has changed and how it can help you understand the impact of changes on performance and channels.
Overall, being able to understand how the App Store reports your data and how it is analyzed, and supplementing that data with keyword ranking changes, will help you grow your app and your business.
 COVID-19 UPDATE