COVID-19 UPDATE

Important Notice:Beware of scams using ASOWorld's name for part-time recruitment or ASO earning app activities. ASOWorld is not hiring any part-time staff. Trust only official information posted by ASOWorld.

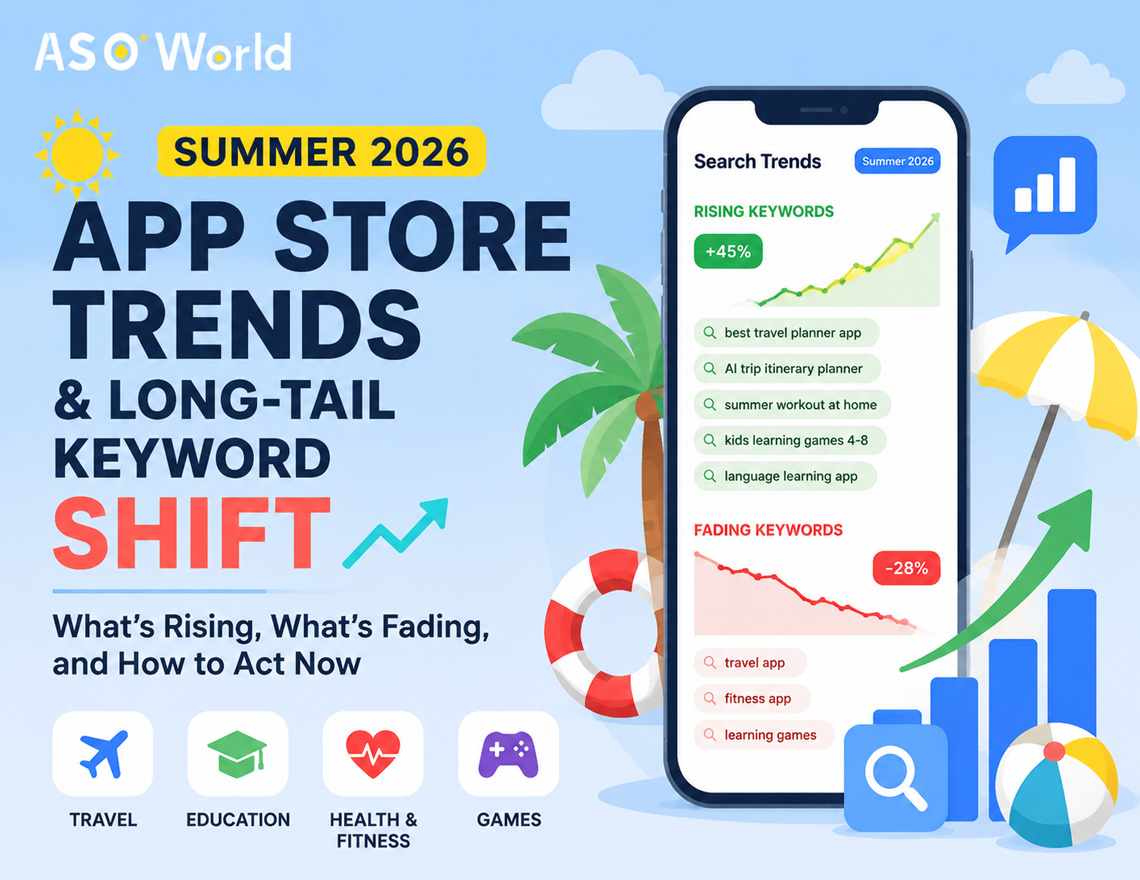
Analyse April 2026 US App Store & Google Play data. Discover how to leverage the 5,000+ app removal wave and zero keyword ranking drops for superior ASO.


The US mobile application market is presenting significant data signals this April 2026. Amidst a record volume of app removals on Google Play, a stabilising keyword landscape, and accelerating pre-order activity across the App Store, the data indicates a clear structural clean-up by the platforms. Developers who systematically analyse these signals early are positioned to acquire newly available market share.
In this technical analysis, we evaluate the latest weekly data from both the US App Store and Google Play (April 20-27, 2026), aggregated via FoxData's real-time market intelligence dashboards, and translate these metrics into data-driven ASO strategies for immediate execution.
The primary statistical anomaly from this week's Google Play US data is the exponential spike in application removals. The underlying metrics are detailed below:
|
Metric |
Value |
WoW Change |
Market Signal |
|---|---|---|---|
|
Total Apps |
2,306,663 |
+892 |
Market approaching saturation |
|
Released Apps |
699 |
+67 |
New entries accelerating subtly |
|
Removed Apps |
5,008 |
+4,794 |
Platform clean-up event |
|
Charts Dropped Apps |
10 |
-62 |
Top charts consolidating |
|
Apps Losing Keyword Rankings |
0 |
-230 |
Keyword environment stabilising |
|
Pre-order Apps |
1,786 |
+61 |
Pre-launch strategy adoption rising |
Data methodology: FoxData App Market Intelligence Dashboard, Google Play US, April 20-26, 2026.
Critical Analysis: For every single app released this week, over 7 were removed. The absolute removal count of 5,008 represents an approximate 100x week-over-week increase from the preceding week's baseline of ~214. This indicates a structural algorithm enforcing strict compliance rather than routine database maintenance.
The convergence of three primary factors is the most rational explanation for this event:
1. Stringent Policy Enforcement (2026 Compliance Updates)
Google Play has progressively restricted its operational policies throughout Q1 2026, systematically targeting low-retention applications, policy-violating software, and unmaintained "zombie" listings. The FoxData Remove Monitor validates this trend—daily removals peaked at 6,947 on April 20 before normalising.
2. Ecosystem Quality Assurance
With the total application index standing at 2.3 million and a net weekly growth of merely +892, the platform algorithm is demonstrably prioritising quality over volume. The removal of 5,008 apps against 699 additions implies Google is deliberately truncating the long tail to enhance discoverability for compliant, high-utility applications.
3. Category-Specific Reductions
FoxData's category-level metrics demonstrate that enforcement is ubiquitous across verticals. However, Casual Games, Entertainment, and Shopping sustained the most significant contractions. Conversely, Tools spearheaded new releases, reflecting developer calculated focus on utility-driven verticals with higher retention probabilities.
For data-focused developers and ASO specialists, this contraction generates a quantifiable market gap. Competitors being de-indexed equates to vacated keyword positions, adjusted category rankings, and liberated organic search volume. Securing this newly available traffic requires the deployment of a structured organic acquisition and keyword ranking strategy.
The most actionable algorithmic indicator this week is that the volume of apps dropping in keyword rankings registered exactly at 0 (a drop of 230 WoW). Concurrently, the FoxData Clearing List/Word Monitor mapped Keywords Dropped Apps peaking at 437 mid-week before decelerating entirely by the weekend.
Market Opportunity: Mass de-indexing + zero keyword ranking degradation = search positions are consolidating exclusively among the remaining authoritative apps. This represents the lowest-risk statistical environment for targeted keyword optimisation observed this quarter.
The Keyword Searching Results Change Rate corroborates this analysis. The Top 10 volatility index fluctuated between 20-60% throughout the week, suggesting logical, non-erratic shifts in the search algorithm. This specific environment ensures that calibrated ASO modifications yield highly predictable performance uplifts.
Initiate a comprehensive metadata audit immediately. The competitive density for mid-tail and long-tail key phrases has statistically lowered. Keywords previously dominated by now-removed applications currently exhibit diminished difficulty scores. Consequently, baseline metadata may experience organic ranking improvements organically, purely due to the reduced competitive set.
However, proactive measures are recommended to maximise yield before the algorithm recalibrates. ASOWorld's keyword ranking and organic growth solutions can systematically audit your matrix to isolate and secure these emerging keyword gaps, ensuring index positioning via algorithmic-compliant campaign pacing.
While the Google Play contraction is statistically significant, the iOS ecosystem demonstrates parallel behavioural shifts. FoxData's Release Monitor data for April 20-27 documents:
Simultaneously, the Pre-Register Monitor records a sustained upward trajectory, peaking at 1,893 pre-registration apps. This quantifies a decisive shift towards front-loading user acquisition efforts.
With an excess of 1,786 apps in pre-order staging on Google Play and approximately 1,900 on the App Store, pre-launch audience aggregation is no longer a peripheral tactic. Pre-launch metrics feed directly into core algorithm ranking factors:
Publishers architecting a new application deployment must construct a rigorous pre-launch funnel. For teams requiring a structured methodology, ASOWorld's foundational ASO framework for new app launches supplies a systematic blueprint for mapping launch protocols, from metadata architecture to review acquisition.
While the US maintains its status as the peak-revenue market, cross-border data identifies where volume and monetisation growth are accelerating:
|
Market Region |
Platform Segment |
Key Metric Status |
Growth Indicator |
|---|---|---|---|
|
United States |
App Store |
8.5B downloads |
+14.42% YoY |
|
United States |
App Store |
$20.2B revenue |
Highest ARPU matrix globally |
|
India |
Google Play |
2B downloads |
+9.95% YoY |
|
Vietnam |
App Store |
— |
+15.50% YoY downloads |
|
Brazil |
Cross-platform |
— |
+209.74% MAU growth |
|
Japan |
Both |
Top 3 on both platforms |
High LTV / ARPU market |
Data methodology: FoxData Global App Market Intelligence, Q1 2026
India's dominance on Google Play (2B downloads, +9.95%) solidifies its position as the primary volume driver. More critically, the monetisation potential is maturing; India's app market revenue recorded a 33% surge to $300M in Q1 2026, demonstrating a transition from pure acquisition to sustainable recurring revenue.
Brazil's +209.74% MAU variance serves as the dataset's most volatile growth indicator. For publishers with the infrastructure to enact full Portuguese localisation, Brazil constitutes a high-yield environment marked by rapid user base expansion and comparatively low keyword competition relative to Western Europe or the US.
Vietnam (+15.50%) sustains its trajectory as Southeast Asia's accelerated vector, whilst South Korea acts as a primary revenue nexus for gaming application publishers. Navigating the highly specific user acquisition behaviour in regions like South Korea requires distinct localisation and technical frameworks — our comprehensive analysis of South Korean mobile gaming user acquisition strategies outlines the vital operational considerations.
ASOWorld provisions professional app store optimisation services spanning over 50 countries — ranging from deterministic keyword ranking programmes to guaranteed user review acquisition. Whether localising for the US, UK, EU, KR, or emerging territories, our platform delivers objective ranking improvements at a competitive CAC.
FoxData's vertical-specific data maps out a distinct enforcement and deployment behaviour model:
Casual Games, Entertainment, Shopping — These sectors experienced the highest enforcement impact, confirming that algorithmic clean-ups are concentrated predominantly on high-volume, potentially policy-violating consumer sectors.
Tools, Education, Productivity — These functional categories recorded the highest injection of new releases, suggesting market confidence is shifting towards SaaS-model applications with verifiable operational utility.
Registering only 10 applications de-indexed from the Top Charts (a reduction of 62 WoW), the primary tier is exhibiting minimal volatility. Market leaders maintain an entrenched position.
Health & Fitness, Finance, Travel & Local processed moderate app removals whilst recording marginal new deployment volume — thereby engineering an optimal low-resistance entry point for correctly optimised products.
The strategic interpretation is straightforward: if your app operates within a category that sustained material removals, overall index saturation has declined. This mathematically warrants the allocation of resources to refresh metadata (Title, Subtitle, Keyword Field), iterate on A/B tested screenshots, and accelerate keyword velocity campaigns to claim improved category standing.
Prior to executing any growth expenditure, definitively verify that your binaries and listings adhere strictly to updated Google Play and App Store protocols. The removal data proves that safety disclosures, permission scopes, consent parameters (aligning with GDPR/UK-GDPR global standards), and privacy documentation are being programmatically reviewed. Failure to comply currently carries the highest de-indexing risk noted in 2026.
The correlation between substantial app un-publishing and zero-loss keyword rankings is transient. Employ ASO intelligence tools to extract search queries that former competitors monopolised, and aggressively target these phrases in your metadata. ASOWorld's targeted keyword ranking service calculates the precise daily download velocity required to secure Top 1-5 positions for objective search terms, scaling organically in compliance with the App Store algorithms.
Deploying approximately 1,900 pre-release apps is now a fundamental market standard. Launching without an established pre-order community forfeits vital algorithmic signals. Configure your pre-launch phase to acquire robust user interest markers (opt-ins and early retention metrics) mathematically required to command day-one indexing bias.
Q: What is the mechanical impact of a mass app removal event on my app's ASO performance?
Mass de-indexing dilutes the competitive density within specific keyword clusters and category ranks. When competitors ranking for mutually targeted terms are removed, their rank allocations evaporate, reducing the total friction required to elevate your application. While passive metadata might rise organically, executing targeted ASO modifications during this suppression window produces statistically elevated yield ratios.
Q: What does the metric "zero keyword ranking losses" denote in Practical ASO?
During the April 20-26 audit window, zero tabulated apps on Google Play US reported a downgrade in their core keyword indexing — shifting drastically from 230 the week prior. This defines an interval of profound algorithm stability where organic ranks are firmly solidifying for active apps. For ASO configuration teams, this flags an optimal, low-risk state to publish iterative metadata updates without triggering negative re-indexing penalties.
Q: Based on 2026 metrics, which geographical boundaries possess the highest yield expansion models?
The US maintains apex volumetric parameters (8.5B iOS downloads; $20.2B ecosystem revenue). Structurally, however, emerging environments are scaling faster: India drives Google Play with 2B volume (+9.95%), Brazil exhibits atypical MAU surges at +209.74%, and Vietnam sustains +15.50% growth on iOS. These markets combine reduced ASO friction with high-growth adoption curves.
Q: Why has the Pre-Order/Pre-Registration framework been classified as a required operation?
Operating a baseline of 1,800-1,900 concurrent pre-registration apps globally validates this as an operational standard. Store algorithms consume pre-launch data (instantaneous day-one download velocity, initial rating velocity) to calculate initial chart placement. Consequently, entering the market lacking a pre-registration funnel inherently subjects the launch to a quantifiable visibility deficit.
Q: Define App Store Optimisation (ASO) and its technical contribution to ROI.
ASO is the systematic refinement of an application's metadata and visual assets to maximise organic visibility and conversion rate (CVR) within app platform architectures. It incorporates keyword matrix structuring, asset A/B testing, listing compliance, and review sentiment management. Because organic search accounts for approximately 65% of net installs globally, calibrated ASO dramatically reduces Blended Customer Acquisition Cost (CAC). Managed platforms such as ASOWorld administer end-to-end data-based deployment configurations.
Q: How do professionals accurately chart competitive metrics in real-time?
Validating algorithmic variations requires robust data-scraping and analytical tools. Software like FoxData supplies continuous tracking of metadata iterations, un-publishing events, search query rank shifts, and vertical-specific KPI velocity across platforms. Translating this raw data into verifiable growth is best managed through ASOWorld's keyword performance and organic acquisition services, ensuring measurable positional advancement.
 Mobile App Growth,Mobile Insights,
Get FREE Optimization Consultation
Let's Grow Your App & Get Massive Traffic!
All content, layout and frame code of all ASOWorld blog sections belong to the original content and technical team, all reproduction and references need to indicate the source and link in the obvious position, otherwise legal responsibility will be pursued.